Azure IIS Paas Application monitoring with Applicare
Available from: Applicare 8 or higher
Dependency: Java 7 or higher
Follow the below steps to monitor IIS applications running in azure with Applicare. Requires Java 7 or higher and will not work with Java 6.
Configuration in Azure Portal to create a service principal.
1. Login into Azure Portal.
2. Search for "azure active directory" and select the "Azure Active Directory" option from the drop-down.

3. Select "App registrations" under the Manage section.

4. Click "+ New Registration" .

5. Click "+ New Registration".
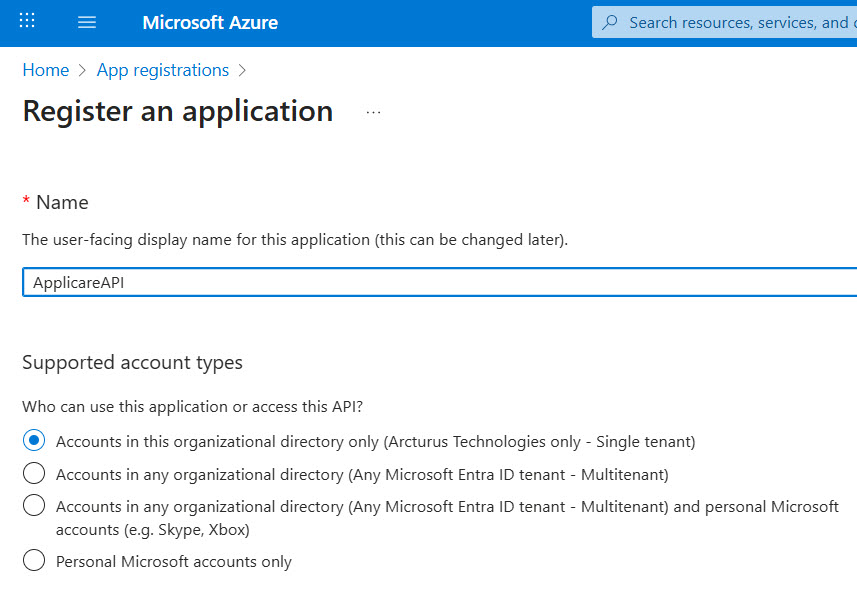
6. Register the application using the below steps and copy the client and tenant Id.
- Enter "ApplicareAPI" in the name field.
- Select option "Accounts in this organizational directory only (Default Directory only - Single tenant)" in the Supported account types.
- Click the "Register" button.

- In the applicare overview screen copy the client and tenant Id and place it in any text file.

Copy and pasted the Id's in a text file.

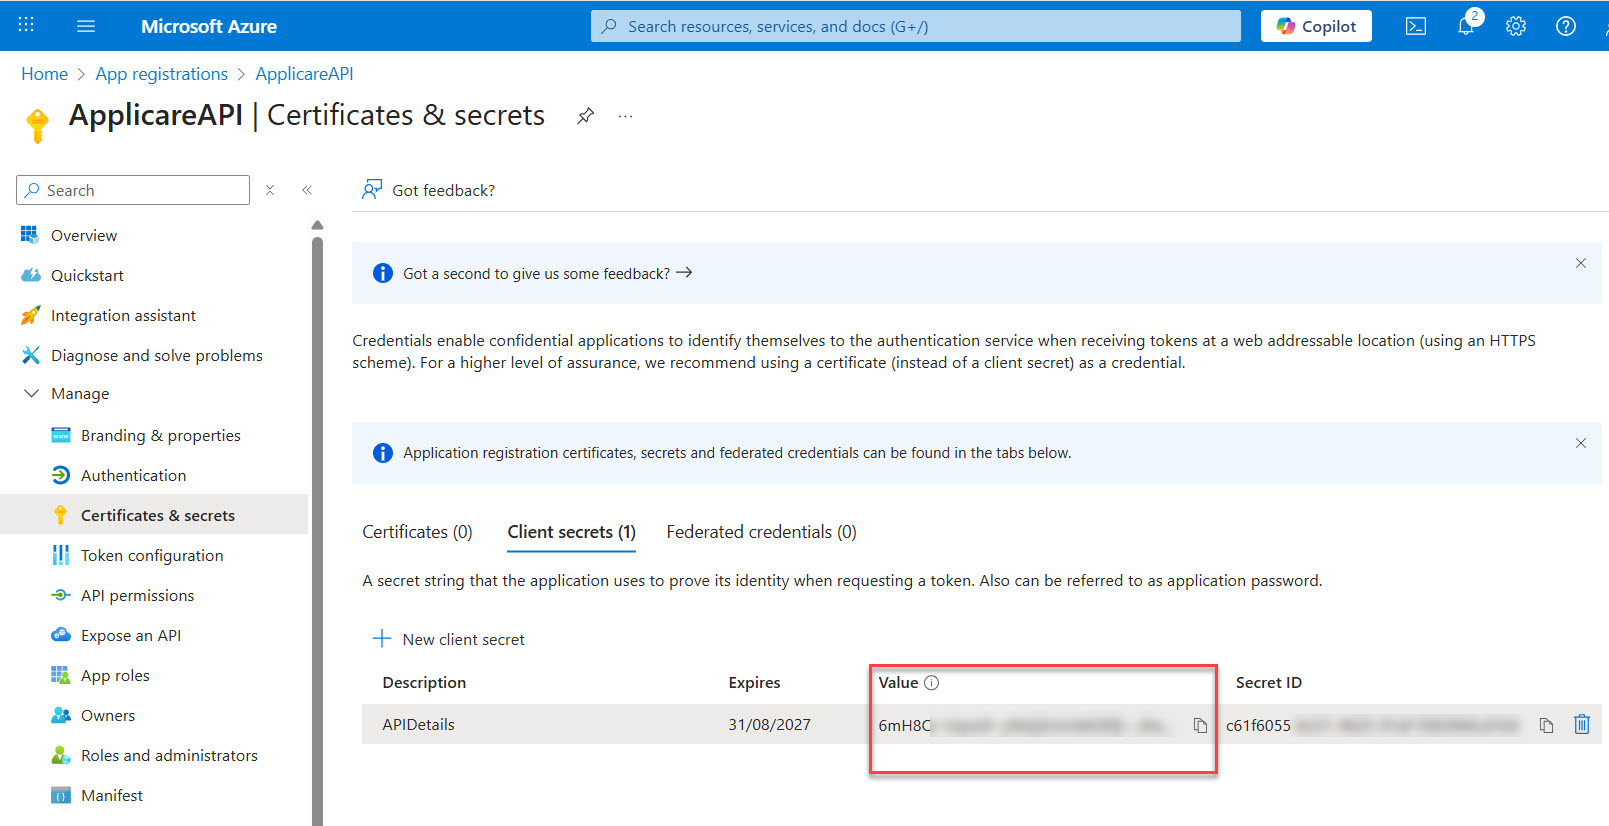
7. Select "Certificates & secrets" from the Manage section.

8. Click "+ New client secret".

9. Follow the below steps to create the client secret key.
- Enter "API" in the description field.
- Click the "Add" button.

10. Copy the secret key value and paste it in the previously created text file and name it as client secret key.


11. Search for "subscriptions" in the search bar and select the "Subscriptions" option.

12.Select the subscription name.

13. Select "Access control (IAM)".

14. Click the "+ Add" button and select "Add role assignment" option.

15. Follow the below steps to add the "applicareapp".
- Select "Reader" option the Role drop-down.
- Select "Azure AD user, group, or service principal" option the Assign Access to drop-down.
- Type "applicare" in the select field and select "applicare".
- Click the "Save" button.

16. Check "applicare" is added as a service principal for the subscription.
- Select Acces Control (IAM).
- Select Role assignments.
- Enter "applicare" in the Name field. If the "applicare" is added successfully it will be displayed in the table.

17. Go to "Overview" screen and copy the subscription Id and paste in the previously created text file.
Note:
The above Id's are used to configure in Applicare Overview menu.
Configuration in Applicare Console.
1. Install the standalone agent.
Please refer the standalone agent installation steps from the below link.
After completing the installation start the agent.
2. Login into Applicare console.
3. Go to "Overview" screen and select the server and click "Edit" button.

4. Scroll down and enable the "Add Azure IIS Configuration" check-box.
- Paste the copied Client Id, Tenant Id, Client secret key and Subscription Id in the respective fields.
- Click the Update button.

5. Select the server and click "Edit" button and select Manage Applications option.

6. Enter the Application name and click Add button and click Save button.

7. Go to "Server Analyzer" menu and select the settings icon.

8. The "Application Monitoring Settings" popup will be opened.
- By default, all the applications will be in the excluded grid.
- Click on the application names which we need to start monitoring. So the selected applications will be moved to the Include monitoring grid.
- Click 'Save" button to save the changes.
- In the next few minutes it will start capture the metrics.
All the applications in the excluded grid.

Selecting applications to move to the included grid.

Save the changes
All the selected applications will be loaded in the drop-down and the metrics tabs will be displayed.

Note: In the next few minutes it will start to collect the metrics.
Click the reload button on the screen to view the metrics details.

Monitoring Metrics in Applicare
1. Go to "Server Analyzer" and select the configured server from the server drop-down.

It will display the below details.

2. Select "Http Metrics" tab to view the Http metric details.

3. Select "IO Metrics" tab to view the IO metric details.

4. To view the metrics for different resolution select the values from "Resolution" drop-down.

Resolution in Minutes:

Resolution in Hours:

Resolution in Days:

5. To view the metrics for different time period select the time in the time drop-down.

Note:
For Azure IIS Paas log monitoring please refer the below link.
Please sign in to leave a comment.


Comments
0 comments