
Lock Detection in Database Monitoring

Deploy Applicare Database Monitoring Agent.
Oracle DB:
In Oracle Database Monitoring locks can be detected using "Applicare_DBLock" Mbean.
1. Go to "Sensor Analyzer" screen and click the "Settings" icon.
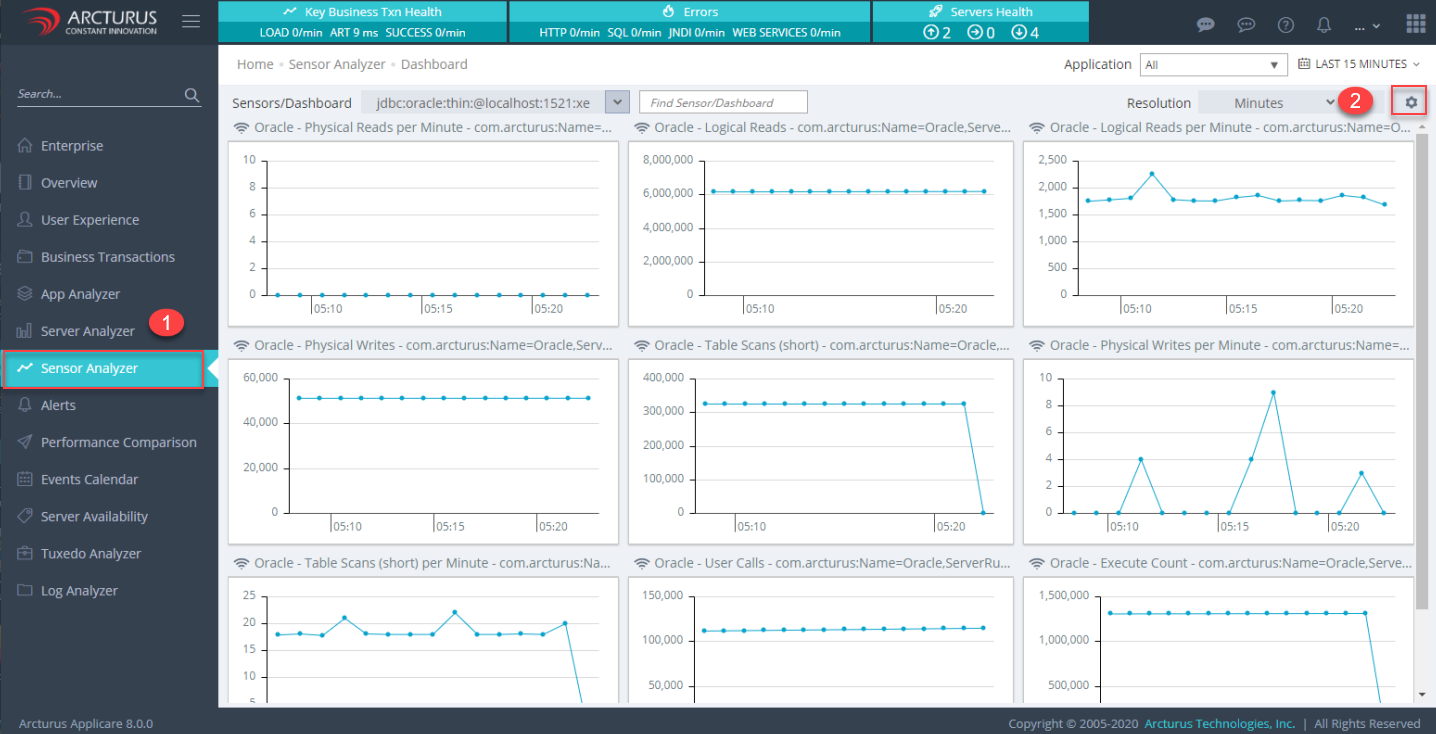
2. Select "JMX" and "Server" from drop-down.

3. Expand the "Applicare_DBLock" tree and select its inner folder. In the right-hand side grid, it will display the lock details in the database.

MySQL DB:
In Mysql Database Monitoring locks can be detected using "Total Locks Immediate", "Total Locks Immediate per Minute", "Total Locks Waited" and "Total Locks Waited per Minute" properties from the "Applicare_DBMonitor" Mbean.
1. Go to "Sensor Analyzer" screen and click the "Settings" icon.

2. Select "JMX" and "Server" from drop-down.

3. Expand the "Applicare_DBMonitor" tree and select its inner folder. In the right-hand side grid, scroll down and see the properties "Total Locks Immediate", "Total Locks Immediate per Minute", "Total Locks Waited" and "Total Locks Waited per Minute" for lock details.

MSSQL DB:
In MSSQL Database Monitoring locks can be detected using "Lock Blocks", "Lock Blocks Allocated", "Lock Memory", "Lock Owner Blocks" and "Lock Owner Blocks Allocated" properties from the "Applicare_DBMonitor" Mbean.
1. Go to "Sensor Analyzer" screen and click the "Settings" icon.

2. Select "JMX" and "Server" from drop-down.

3. Expand the "Applicare_DBMonitor" tree and select its inner folder. In the right-hand side grid, scroll down and see the properties "Lock Blocks", "Lock Blocks Allocated", "Lock Memory", "Lock Owner Blocks" and "Lock Owner Blocks Allocated" for lock details.

Follow the below steps to add the custom Dashboard.
- Select the row(s) from the grid. Multiple rows can be selected at the same time.
- Select "New" in the Dashboards drop-down.
- Enter the custom "name" for dashboard.
- Click the "Add sensors" button. It will start monitoring.

Follow the below steps to view the custom Dashboard
- Click the "back arrow" icon to go to the dashboard screen.

- Select the "dashboard name" from the Sensors/Dashboard drop-down to view the dashboard.


Note:
By default all the properties available under "Applicare_DBMonitor" will be automatically added as a custom dashboard in Applicare.
To view that
- Go to the "Sensor Analyzer" Screen.
- Select the dashboard name from Sensors/Dashboard drop-down. In this case the dashboard name will be the "DB_URL" which we configured in the overview screen while adding the agent.
- Click the "Load Sensors" button and scroll down to view more dashboards.


Please sign in to leave a comment.
Comments
0 comments