
Create JMX Sensors/Sensors Dashboard

Create Sensor Dashboard
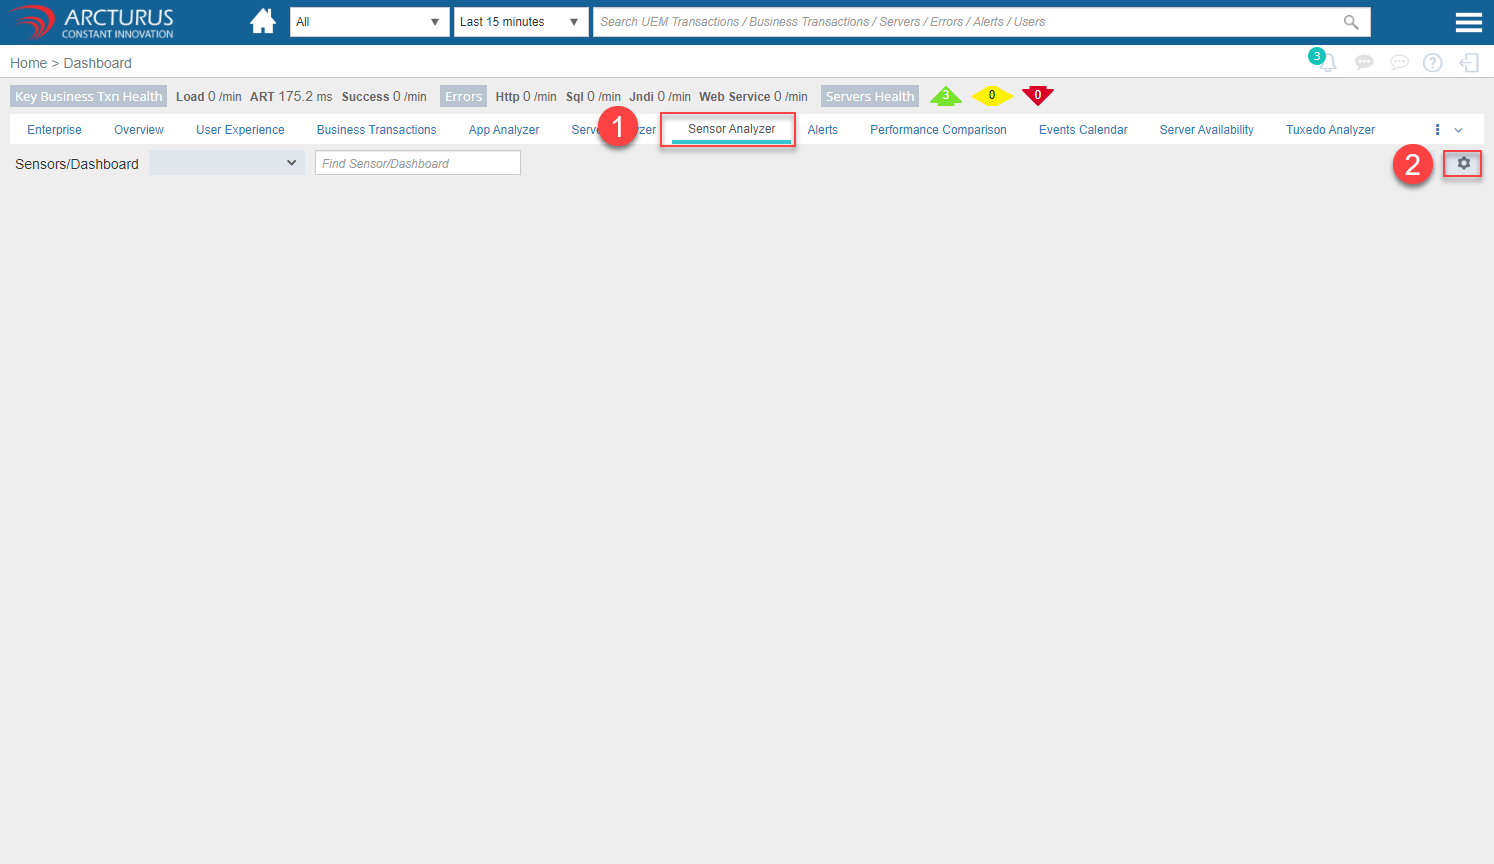
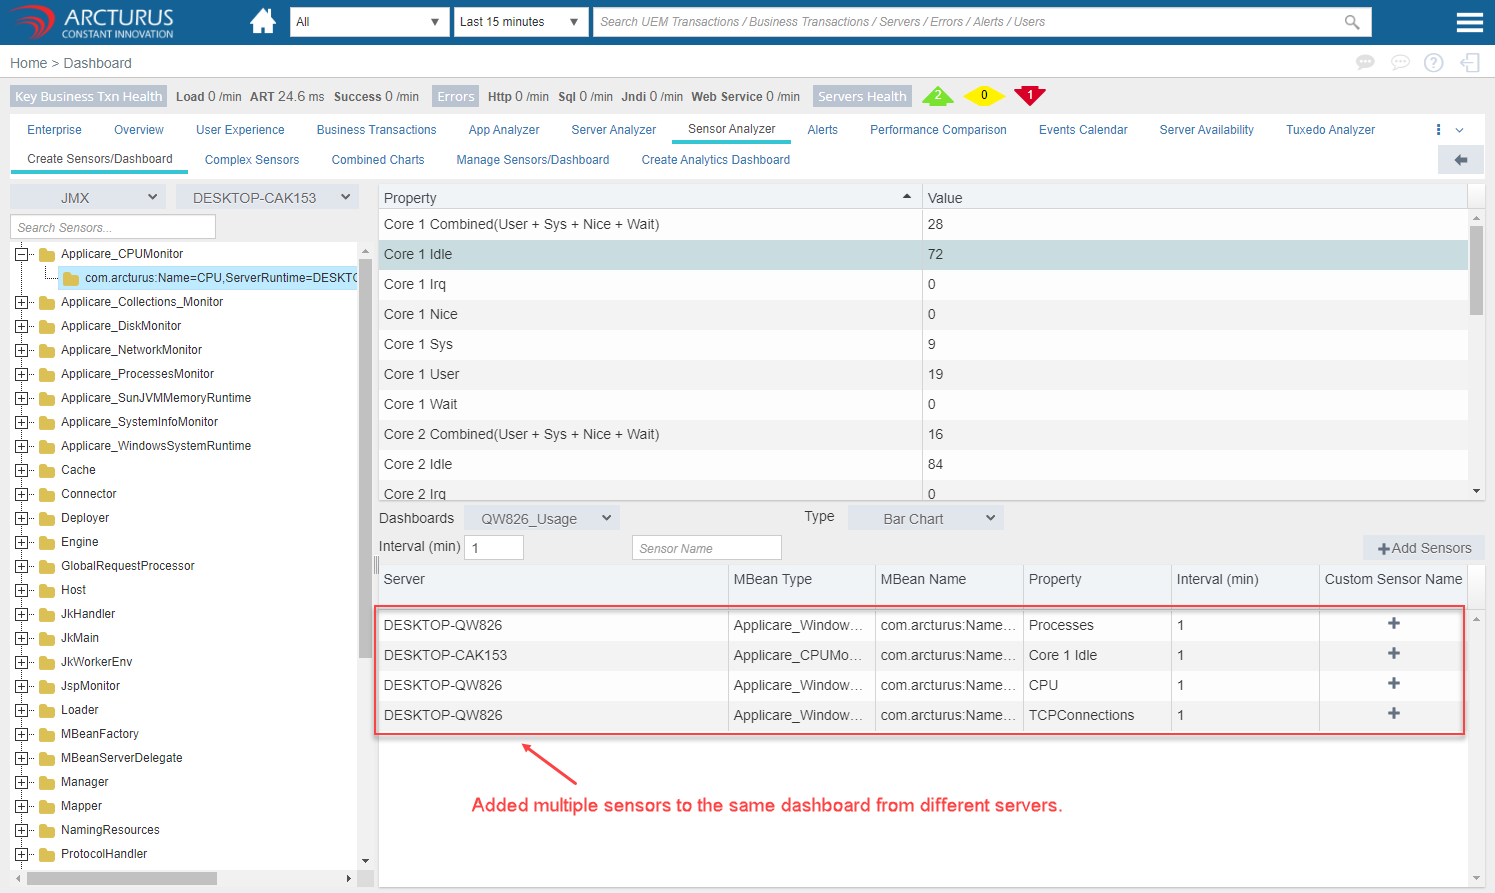
To Create a Sensors Dashboard in the Applicare console, go to Sensor Analyzer -> Click on Settings Button (Wheel Icon) in the right corner.
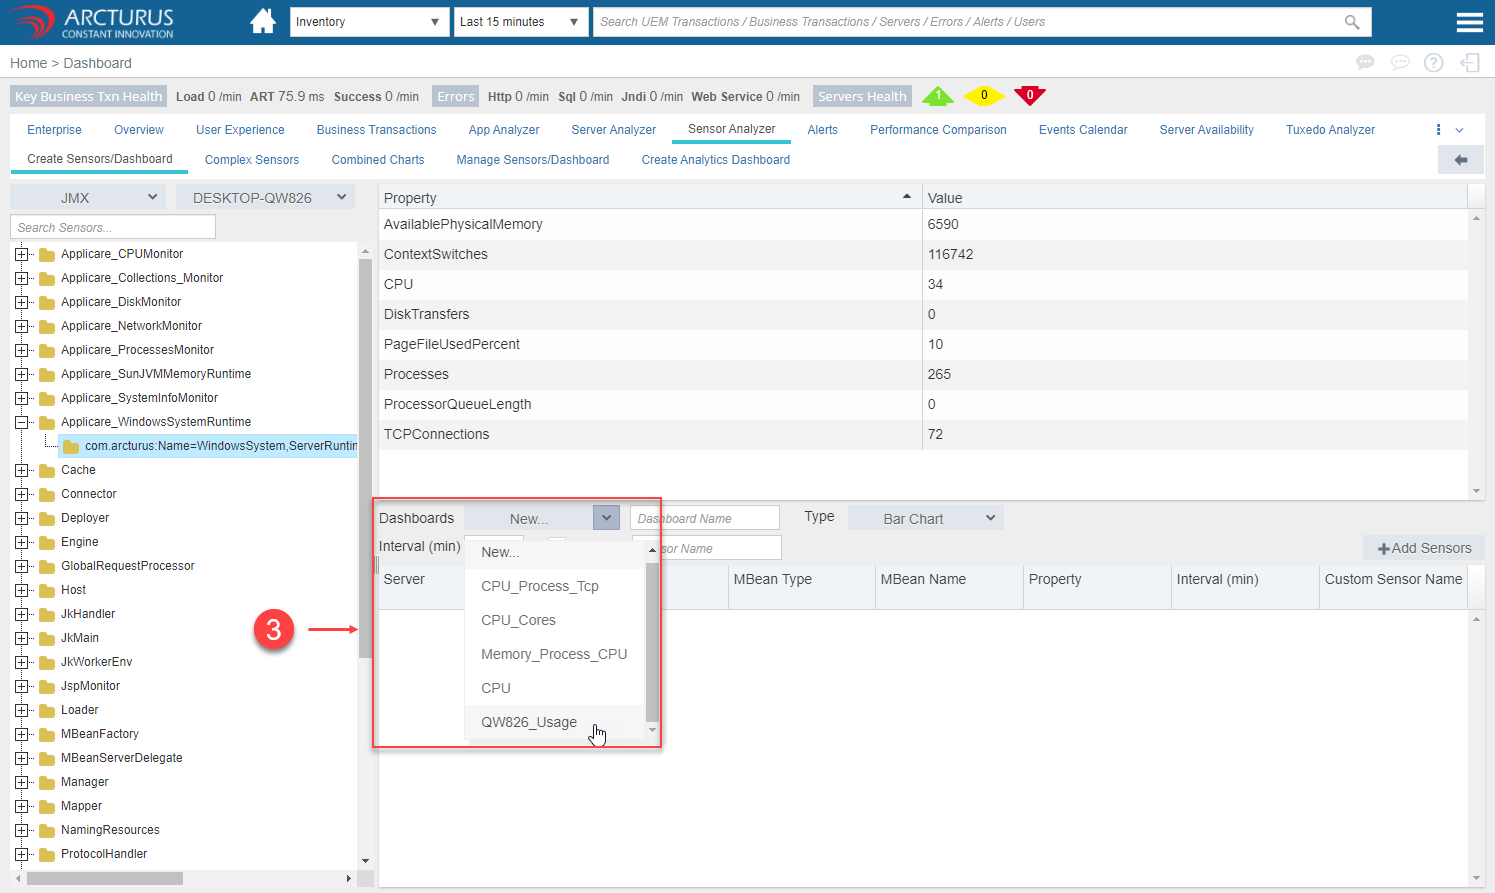
1. Expand the sensors tree.
2. Select the properties you want to create sensors on.
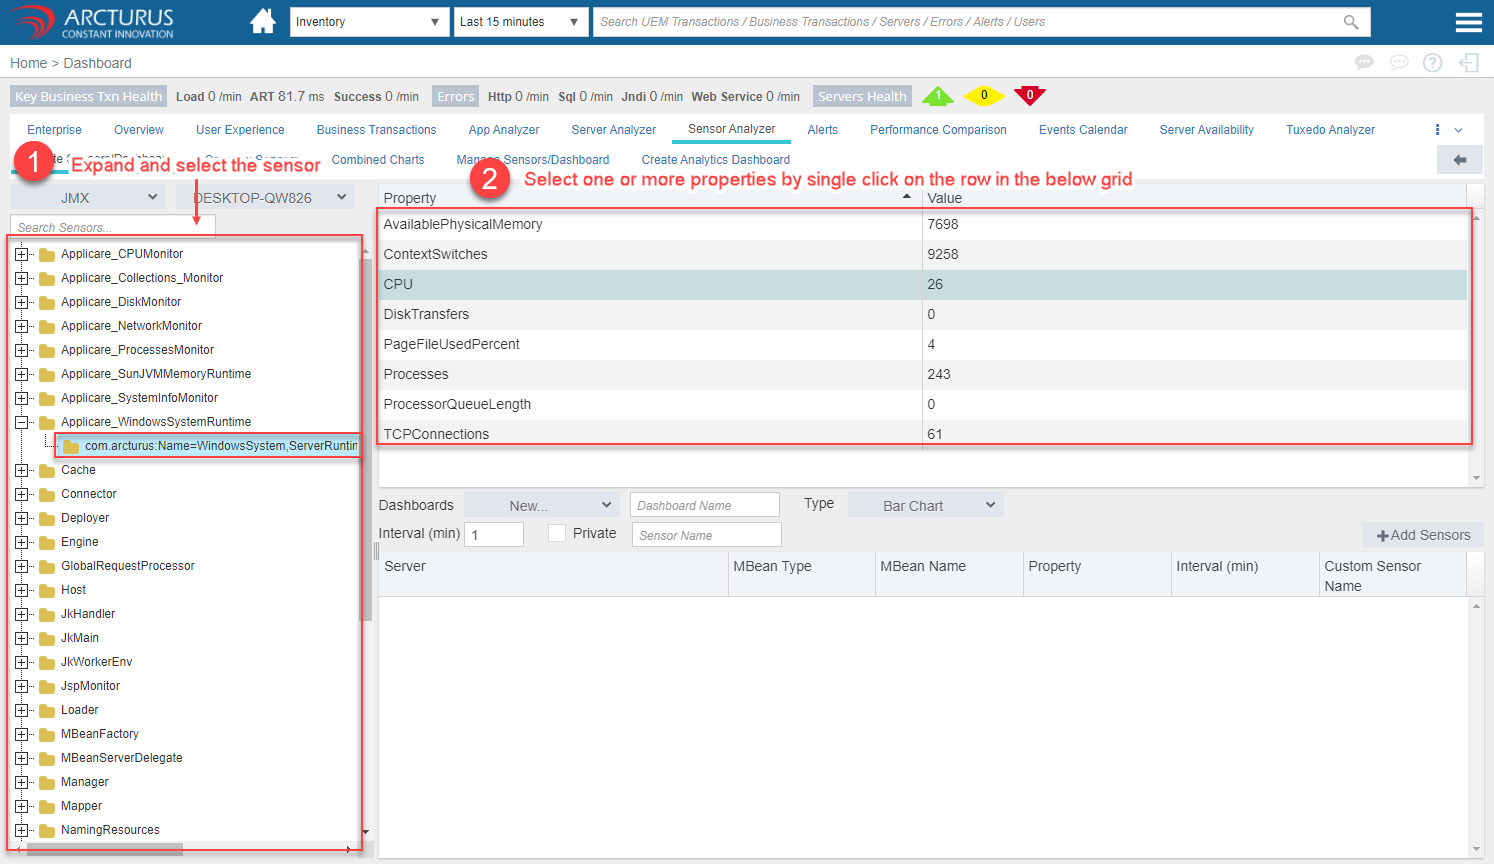
3. Make sure "New" option is selected in the Dashboard drop-down.
4. Enter the Dashboard name.
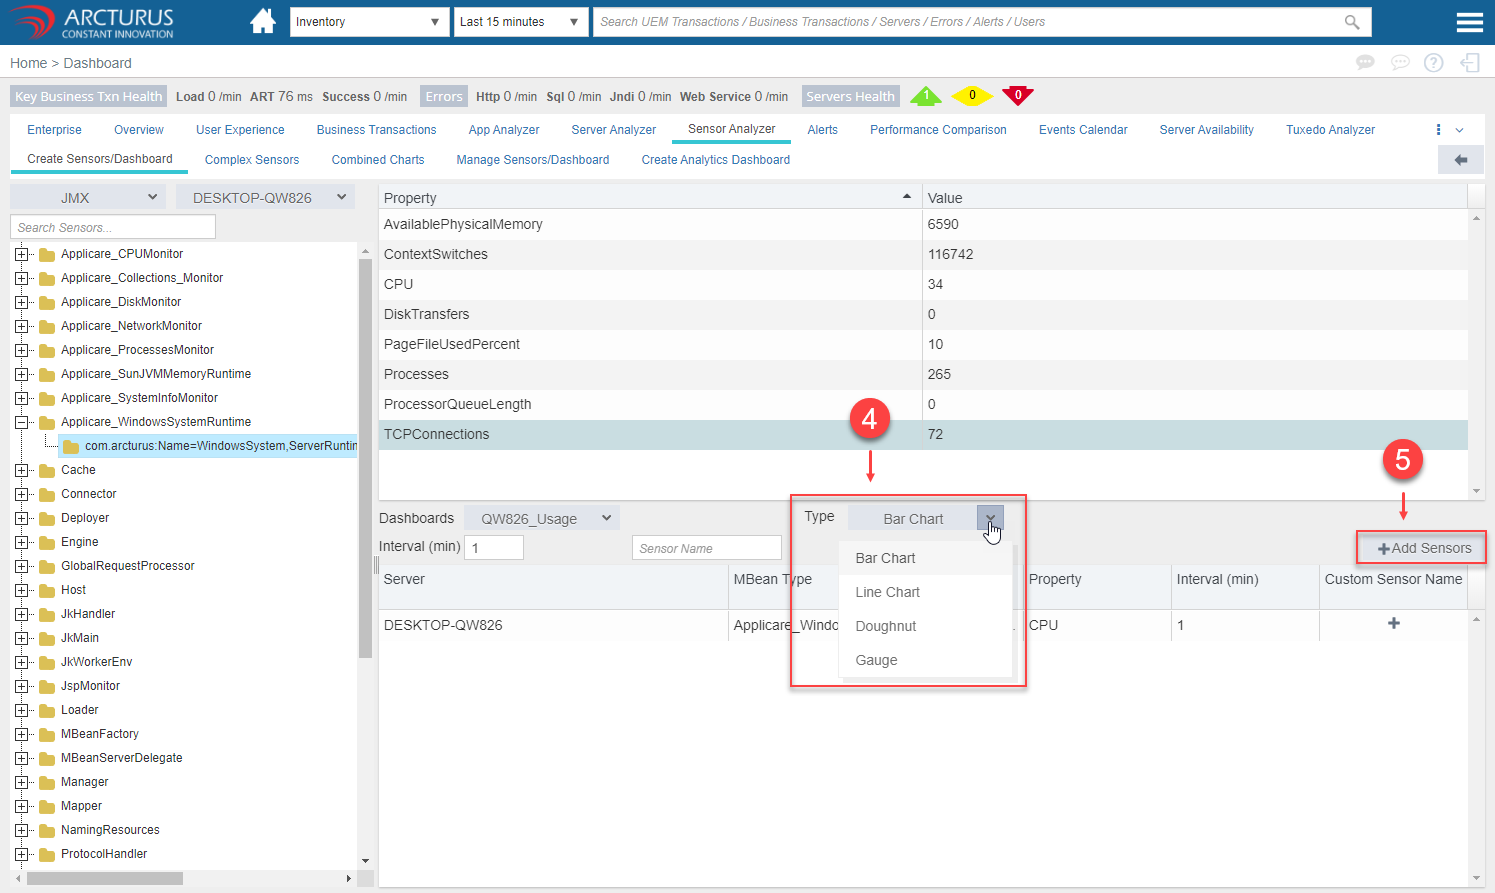
5. Select the Dashboard Type in the Type drop-down.
6. Click the "Add Sensors" button.

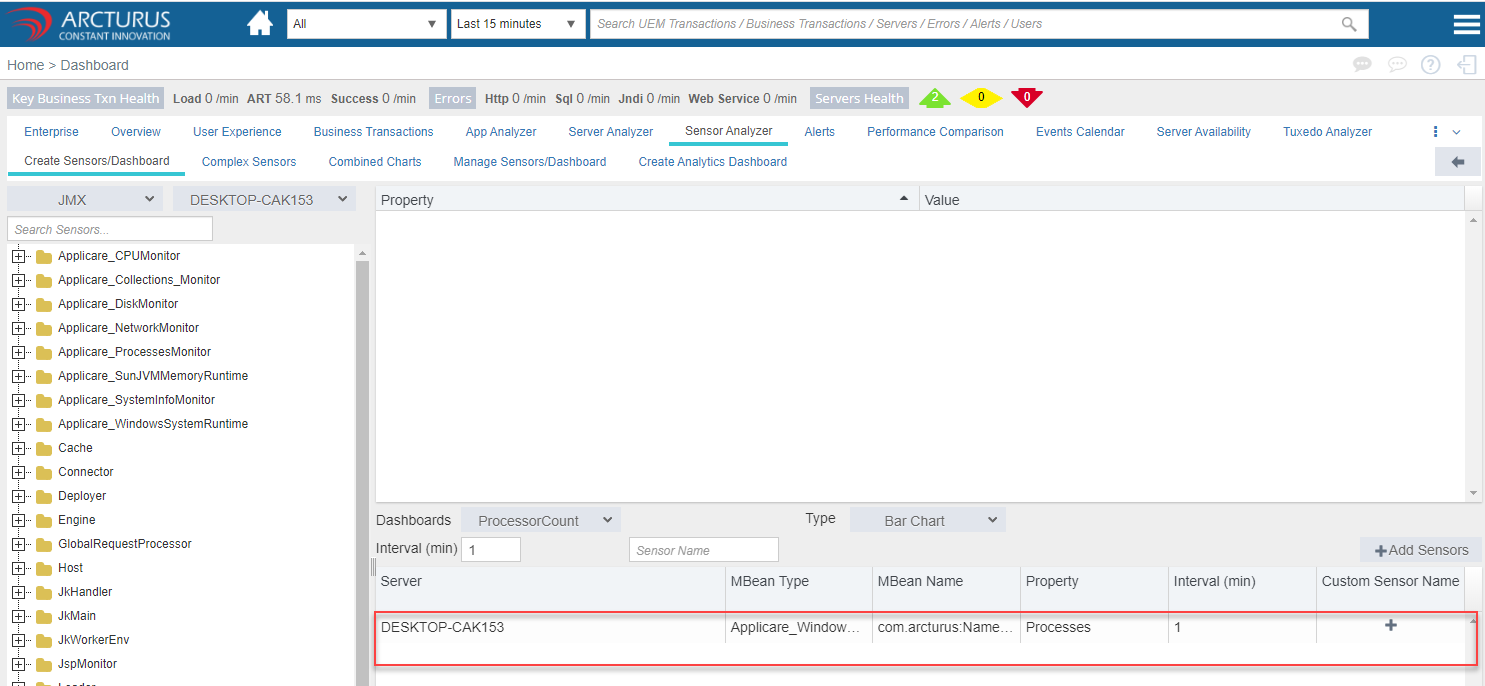
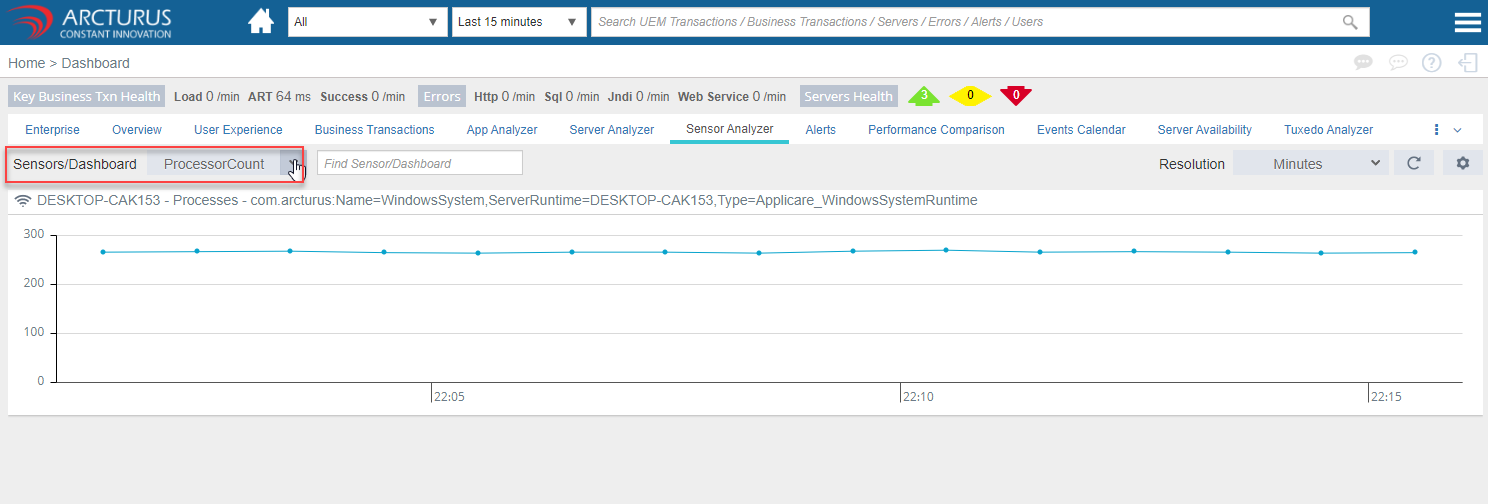
The added dashboard will be displayed in the grid.
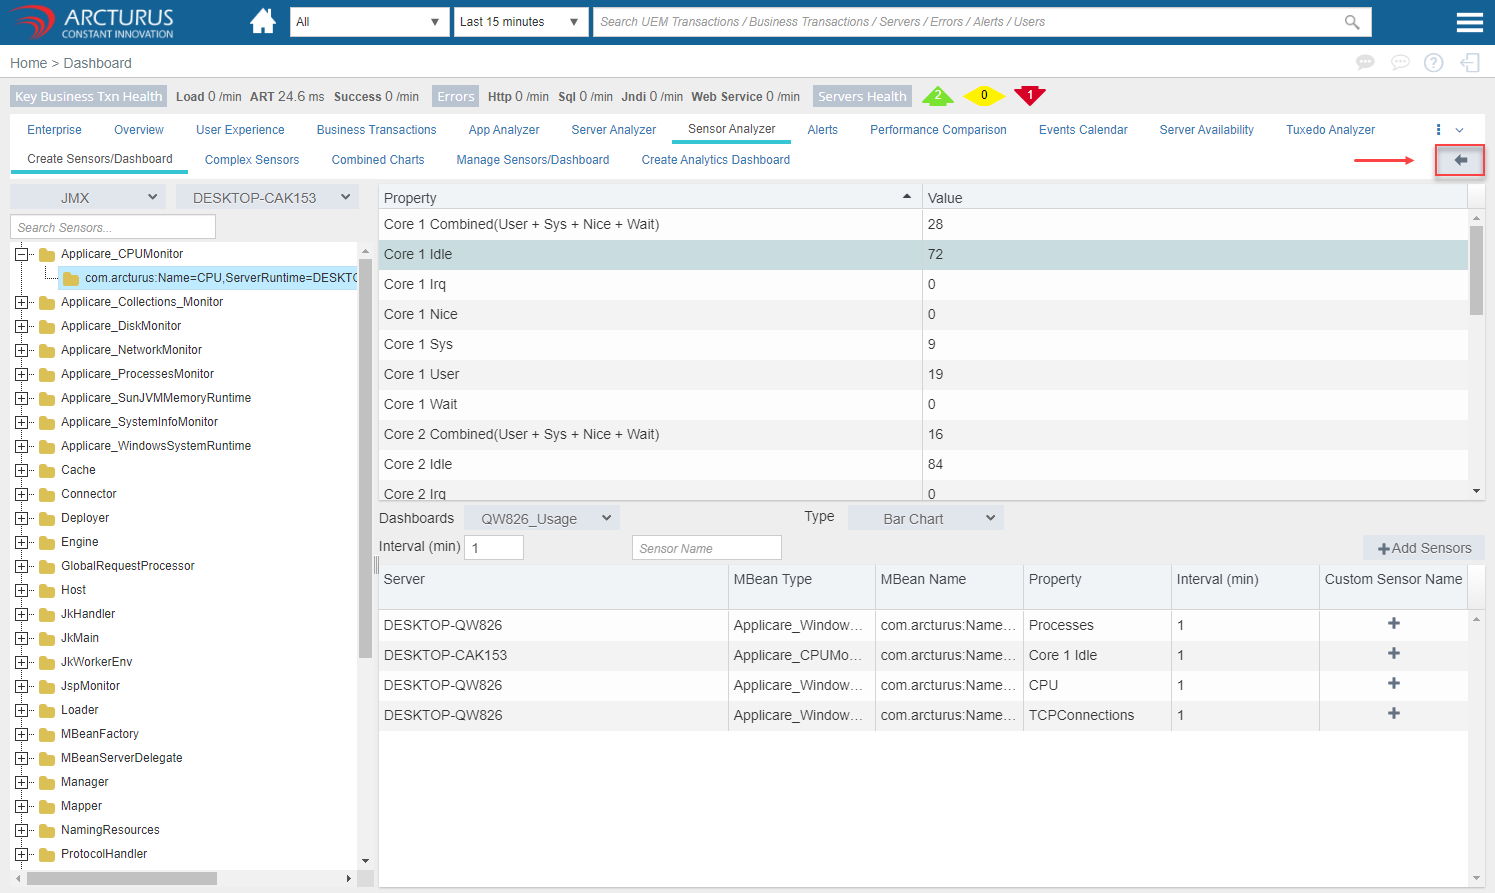
Click the back arrow to view the added dashboard.
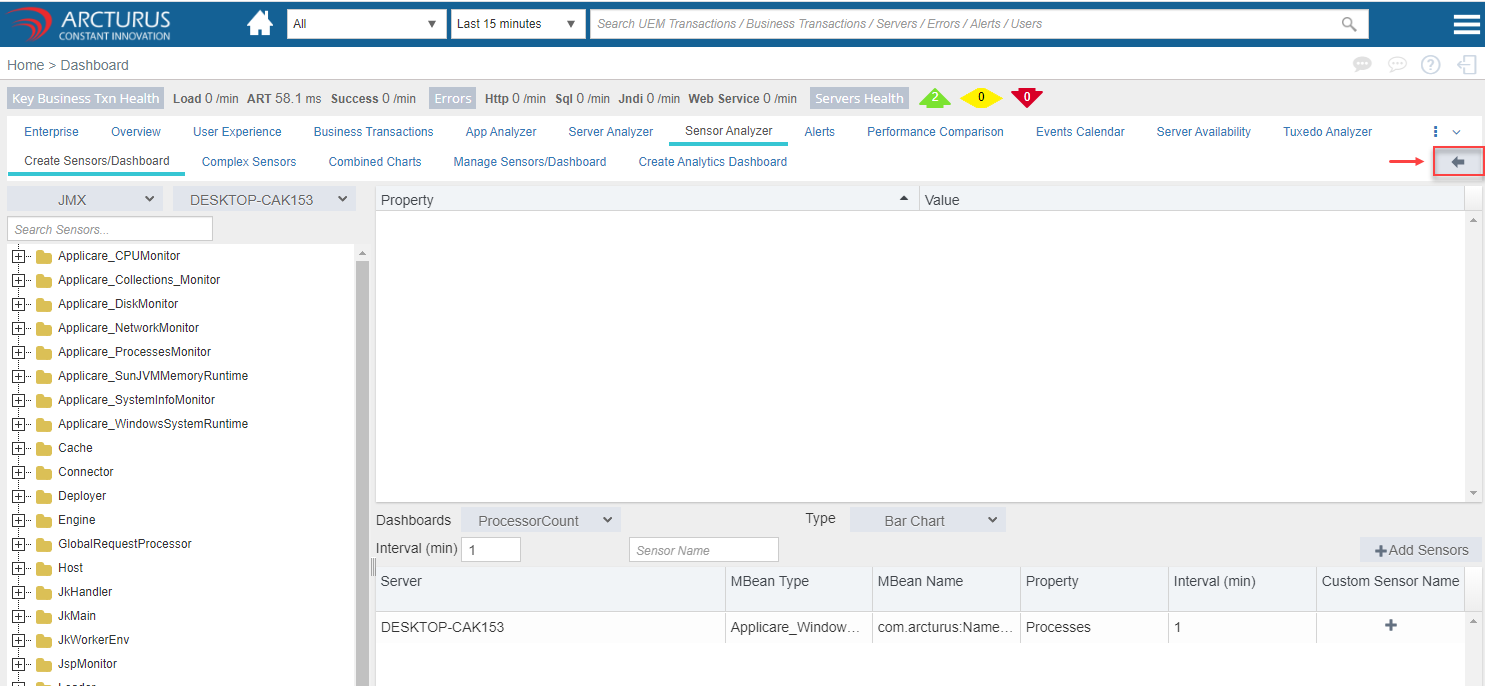
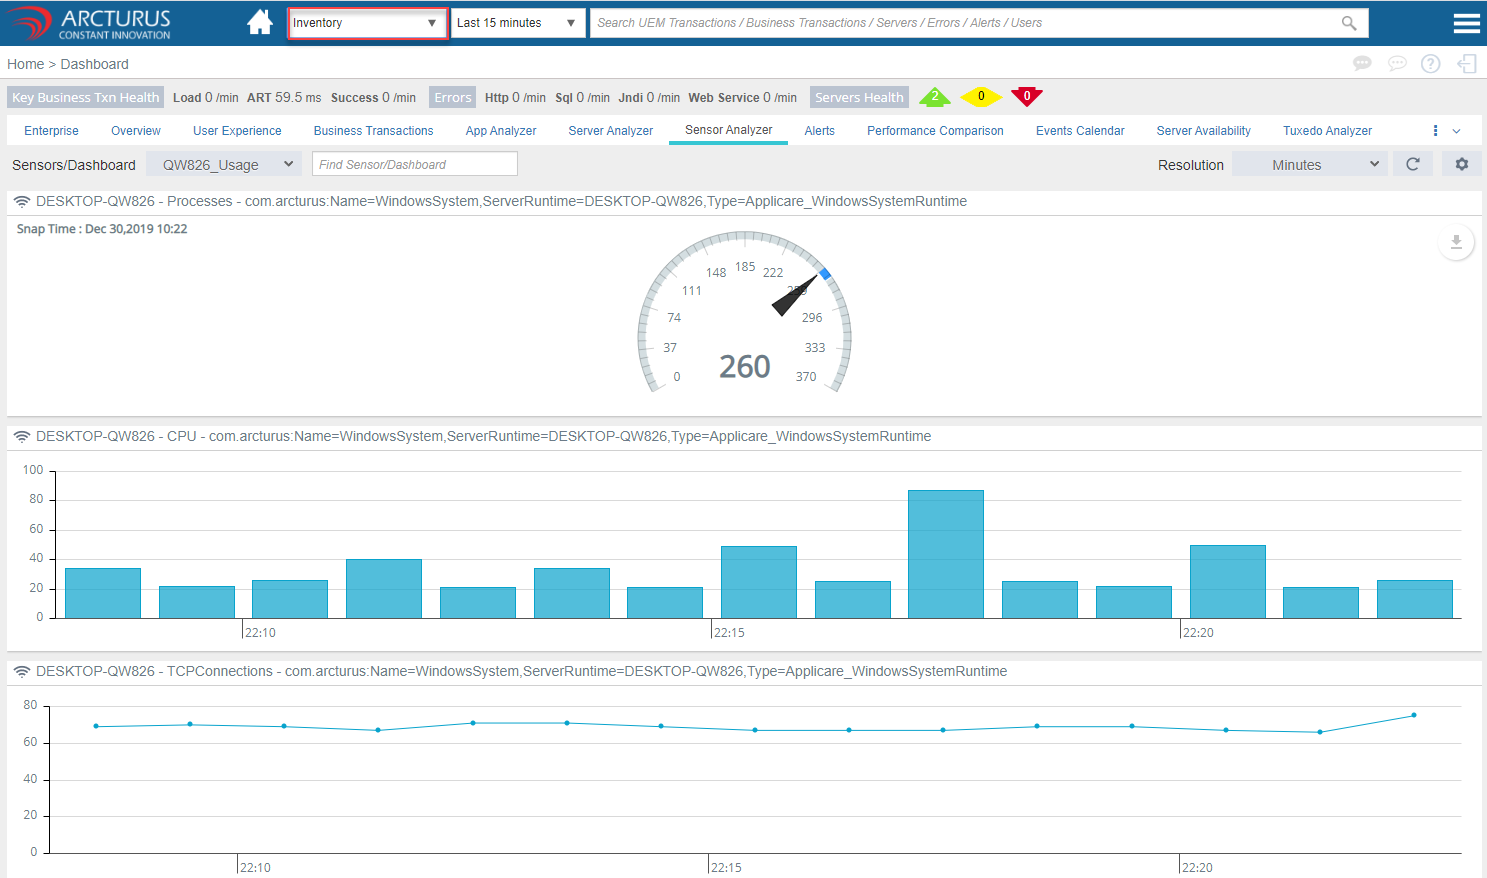
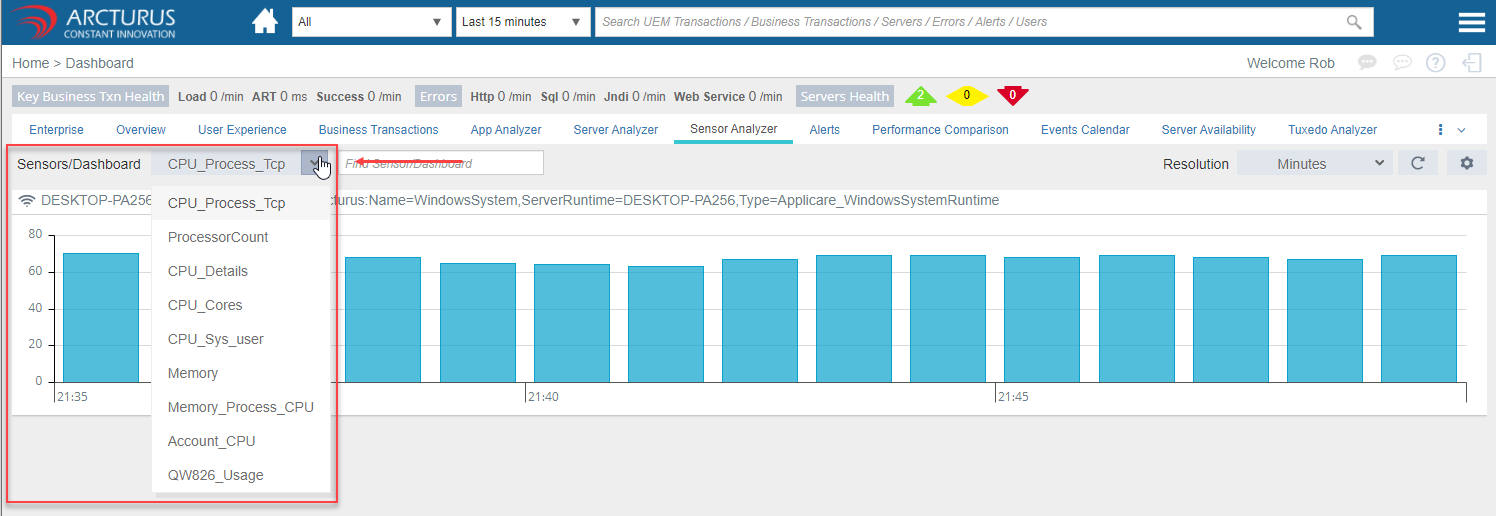
Select the dashboard from the Sensors/Dashboard drop-down to view.
Adding multiple sensors charts to the dashboard
Click the settings icon in the Dashboard screen.

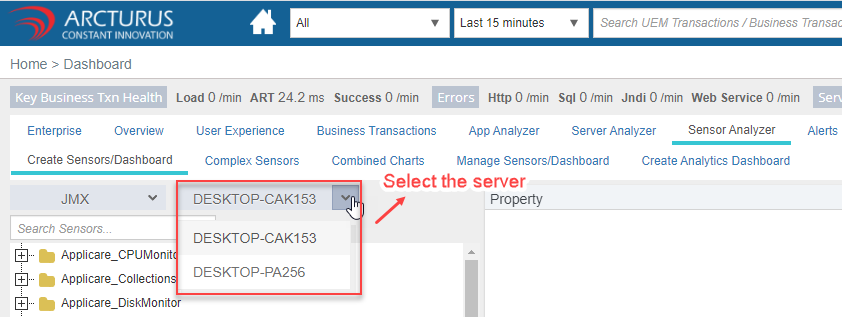
Select the server from the server drop-down. The first server in the drop-down option will be selected by default.
1. Expand the sensors tree.
2. Select the needed properties.

3. Select the previously added Dashboard in the dashboard drop-down.
4. For different dashboard type select the dashboard type in the Type drop-down or else no change needed.
5. Click the "Add Sensors" button.
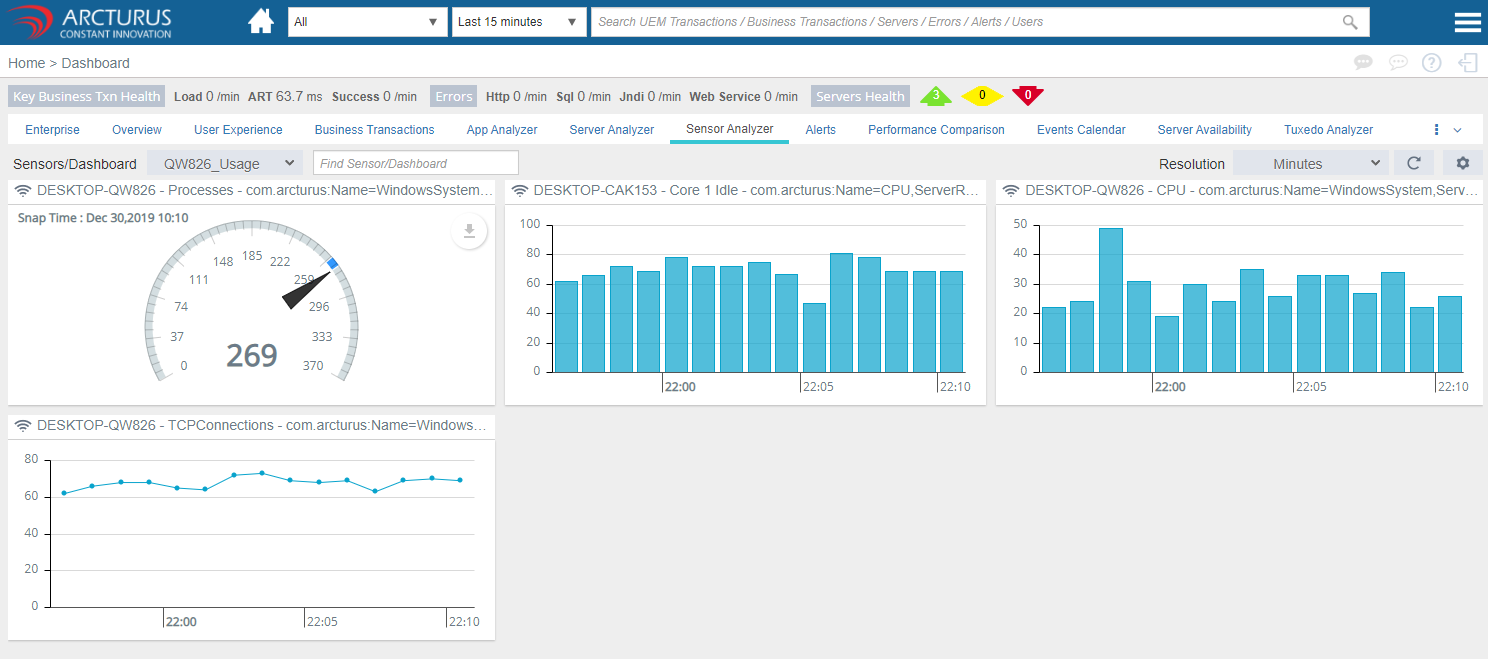
The added dashboard will be displayed in the grid.
Click the back arrow to view the added dashboard.
Creating combined charts with multiple sensors
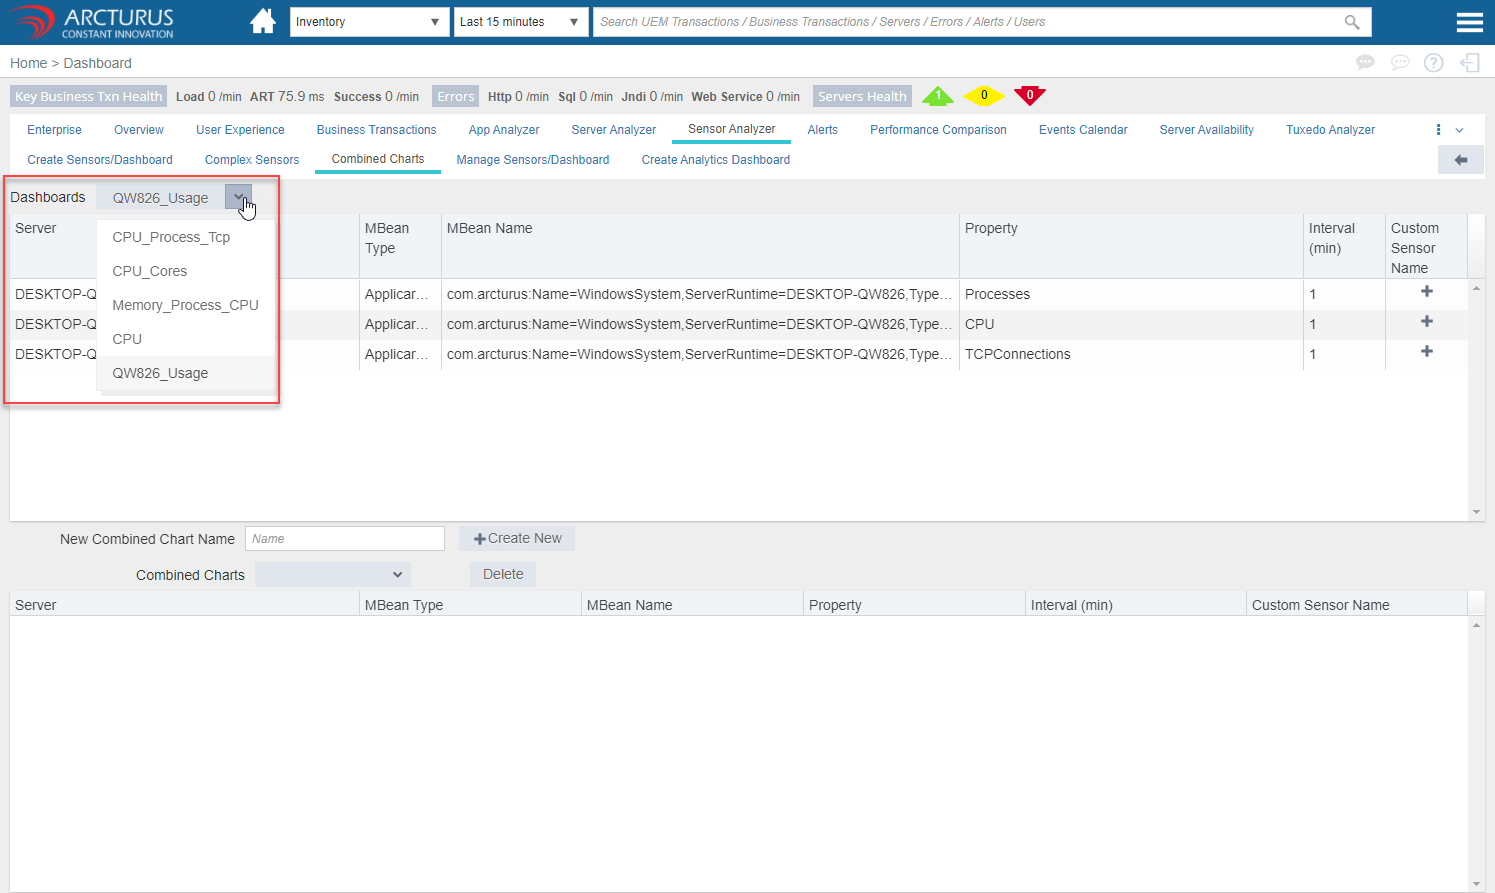
1. Go to Combined Charts screen.
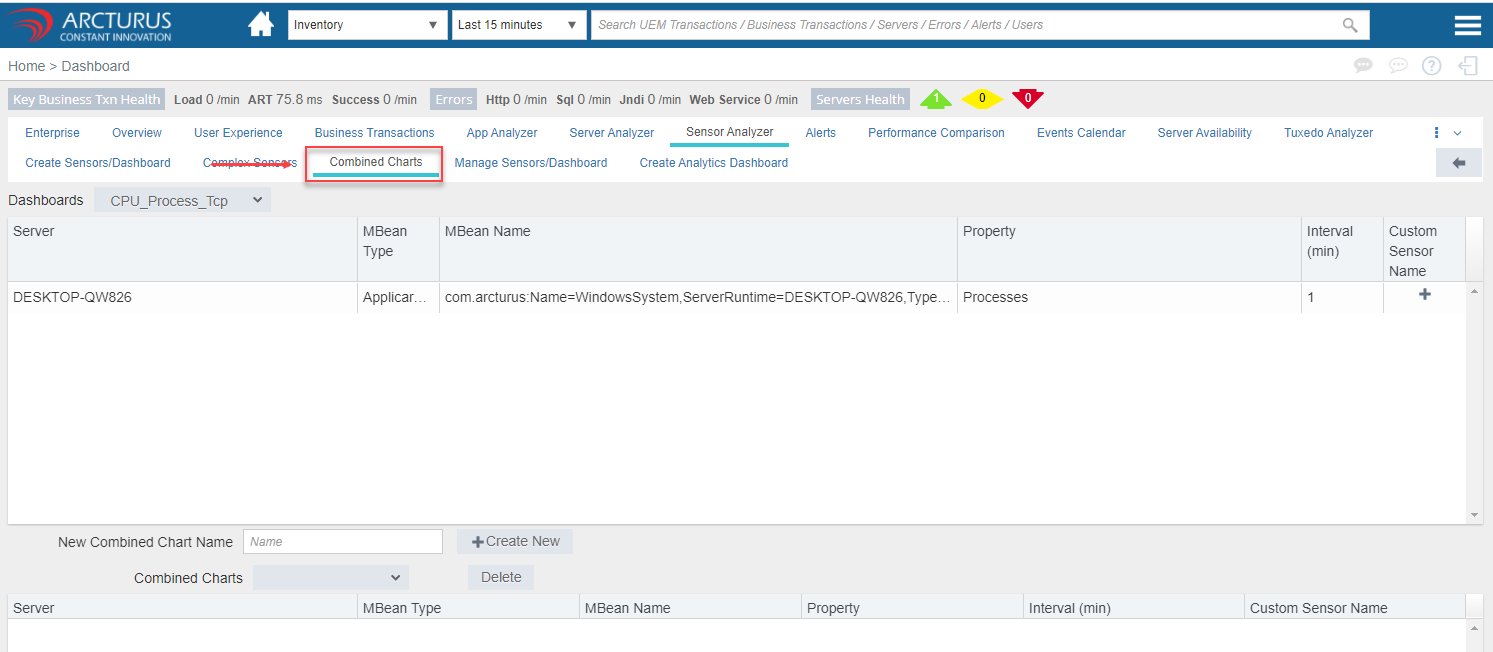
2. Select the dashboard from the dashboard drop-down.
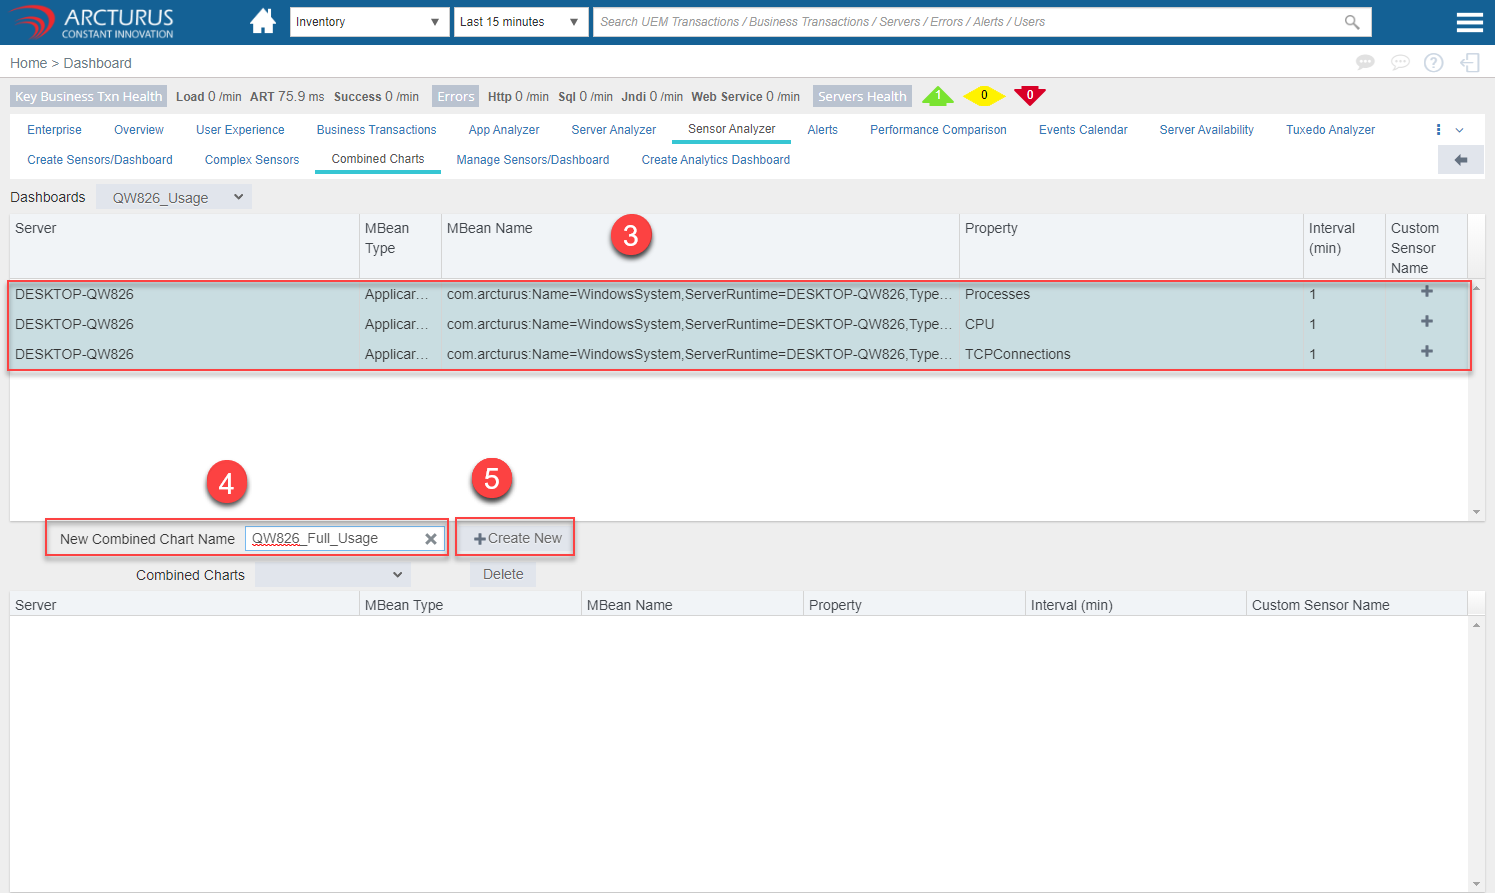
3. More than one sensor should be selected in the grid to create a combined chart.
4. Enter the name for combined chart in the New Combined Chart name field (title for the dashboard).
5. Click the "Create New" button.
Click the back arrow.
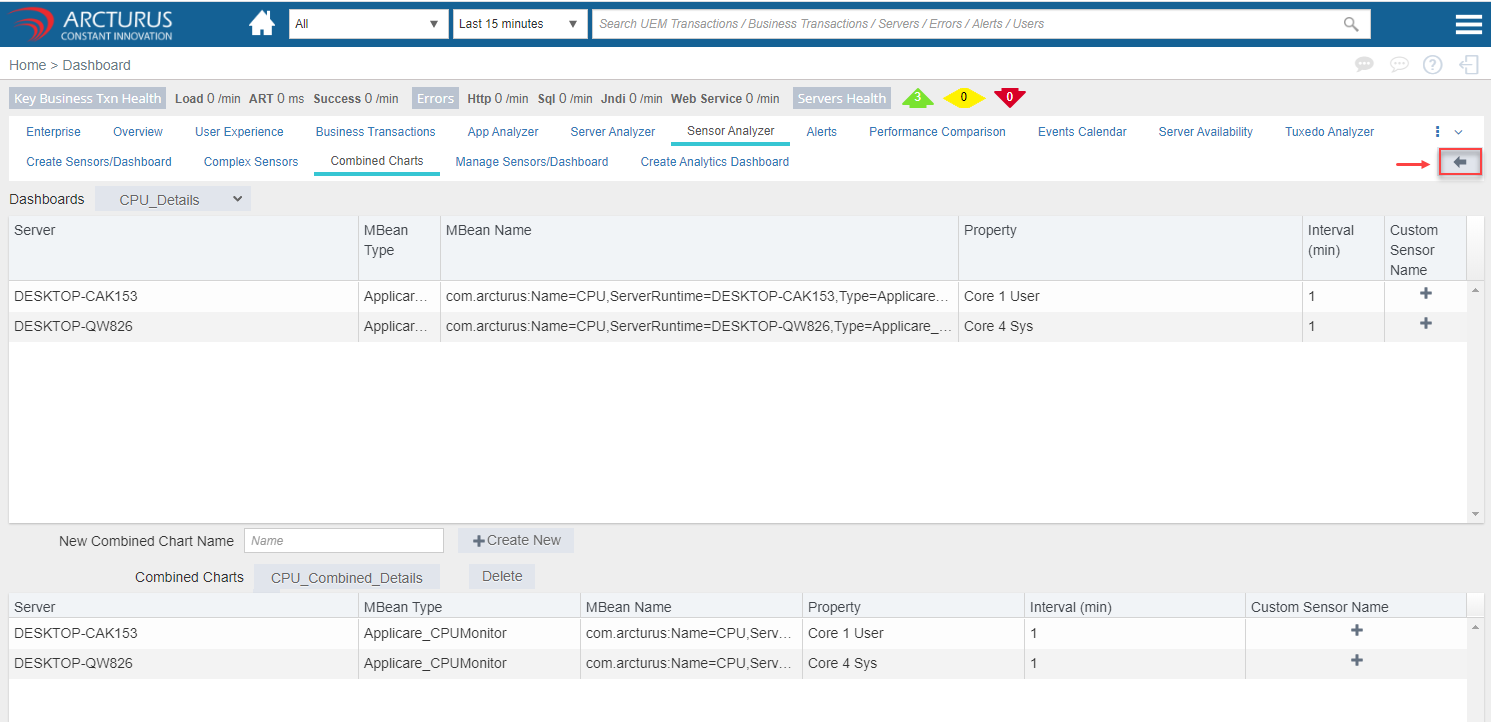
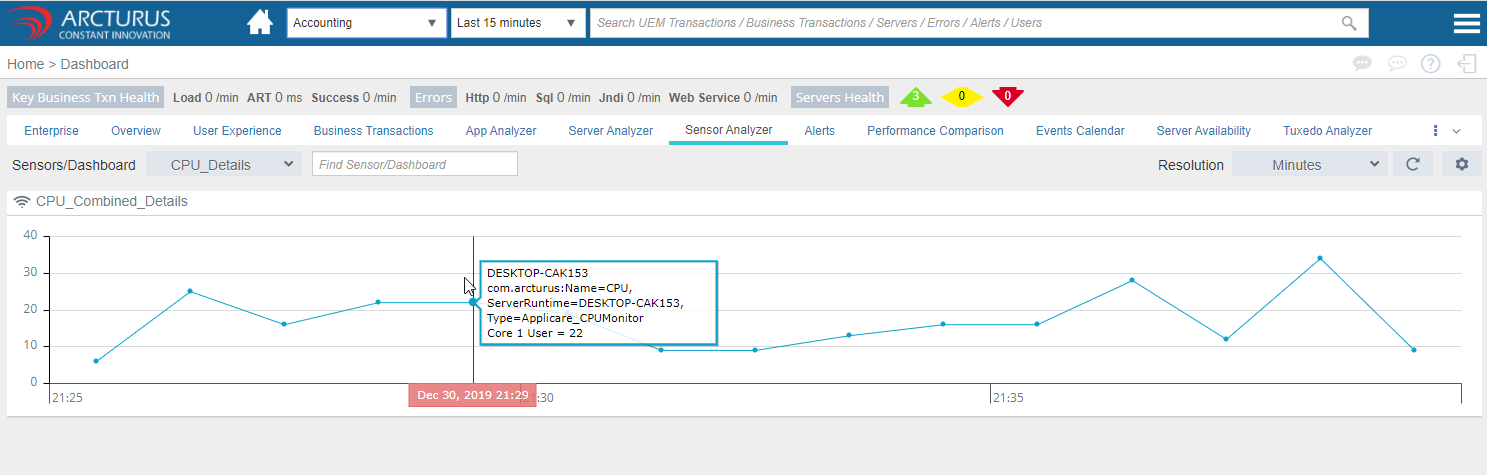
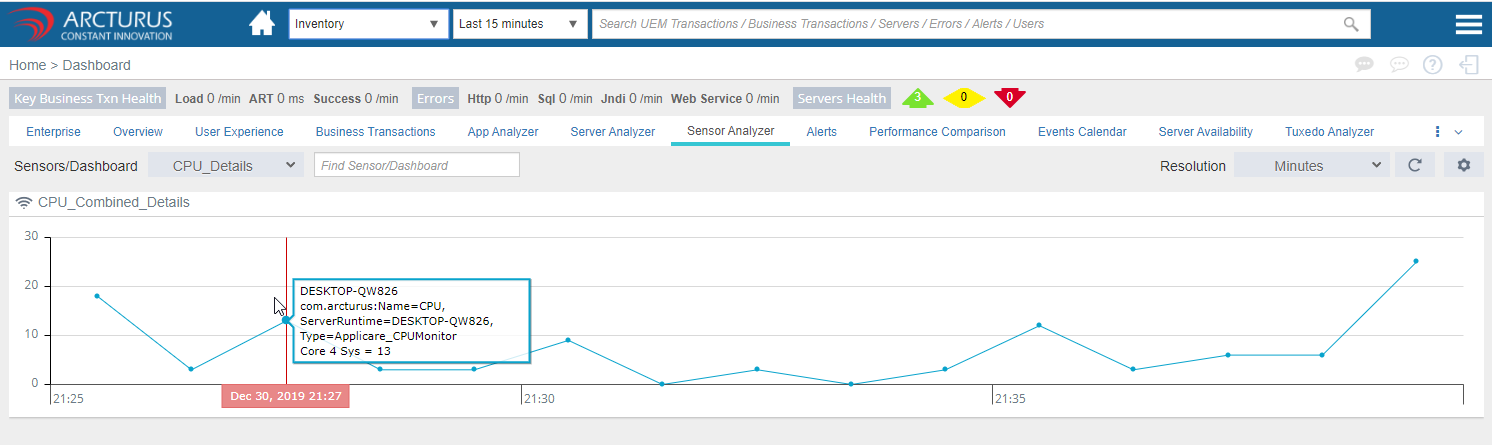
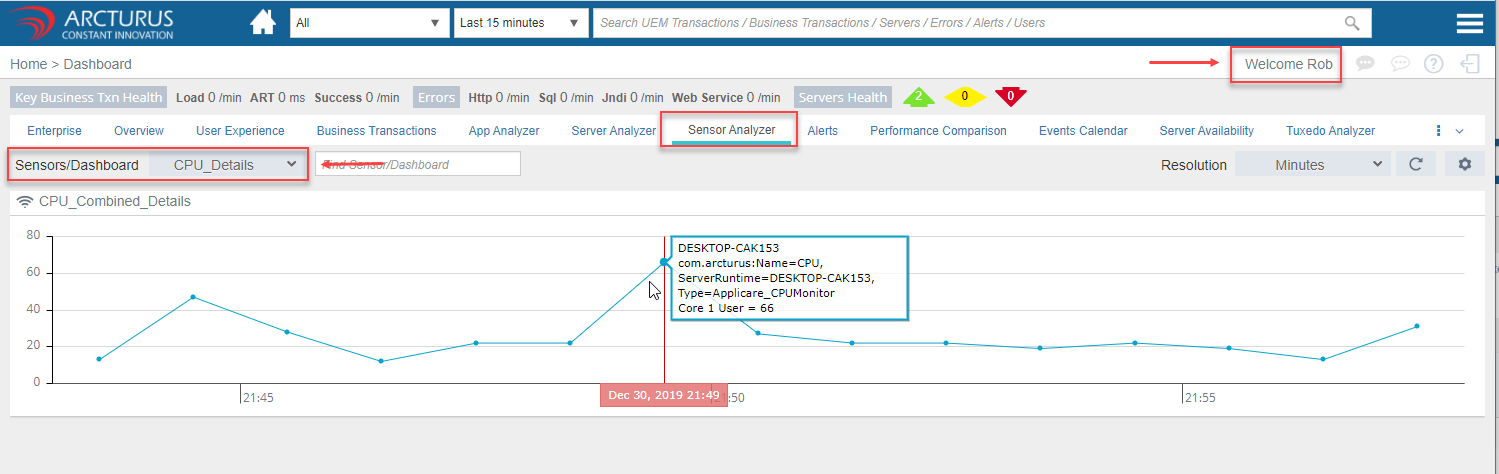
Select the dashboard from the Dashboard drop-down. Combined sensors dashboard will be displayed in line chart.

Application specific dashboards
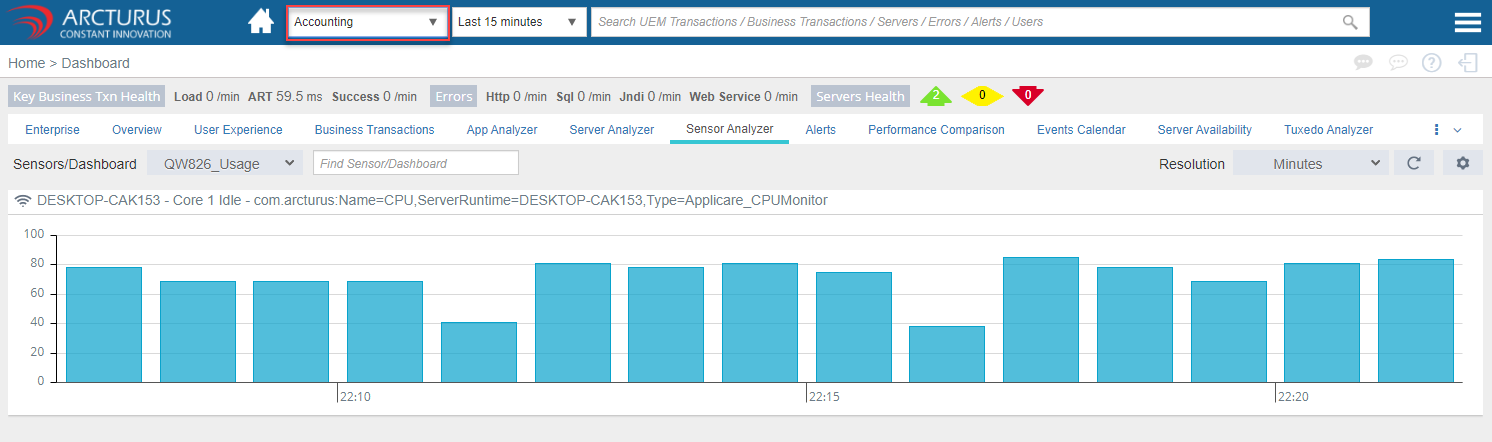
1. Select the application from the application drop-down.
2. Select the dashboard from the dashboard drop-down.
Combined Sensor Chart
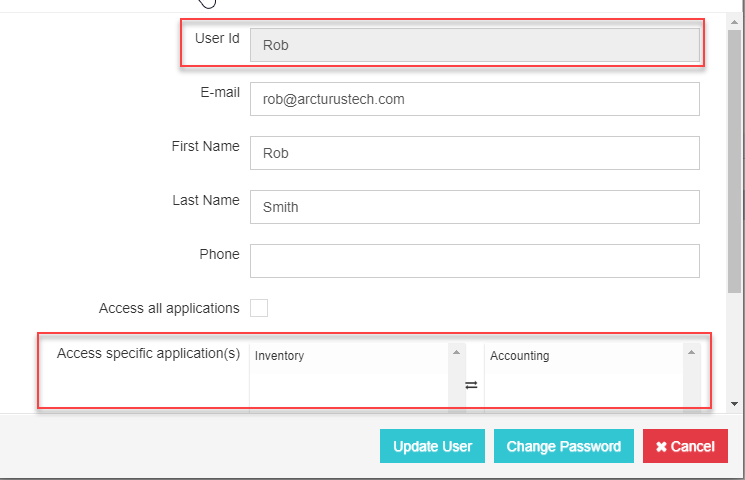
Combined sensor chart shows only the permissible sensors for a specific user even though the combined chart may include other sensors.
Note: Non-Admin users with access to specific servers will see the sensors for those servers only.
e.g. Rob user has access to "Accounting" application. So he can view all the sensors dashboards created for the servers inside the "Accounting" application. He would not see the sensors created for other servers.
Viewing Sensor Dashboards for Admin and Non-Admin users.
Non-Admin User
Logged in as Rob and viewing the sensors dashboards.
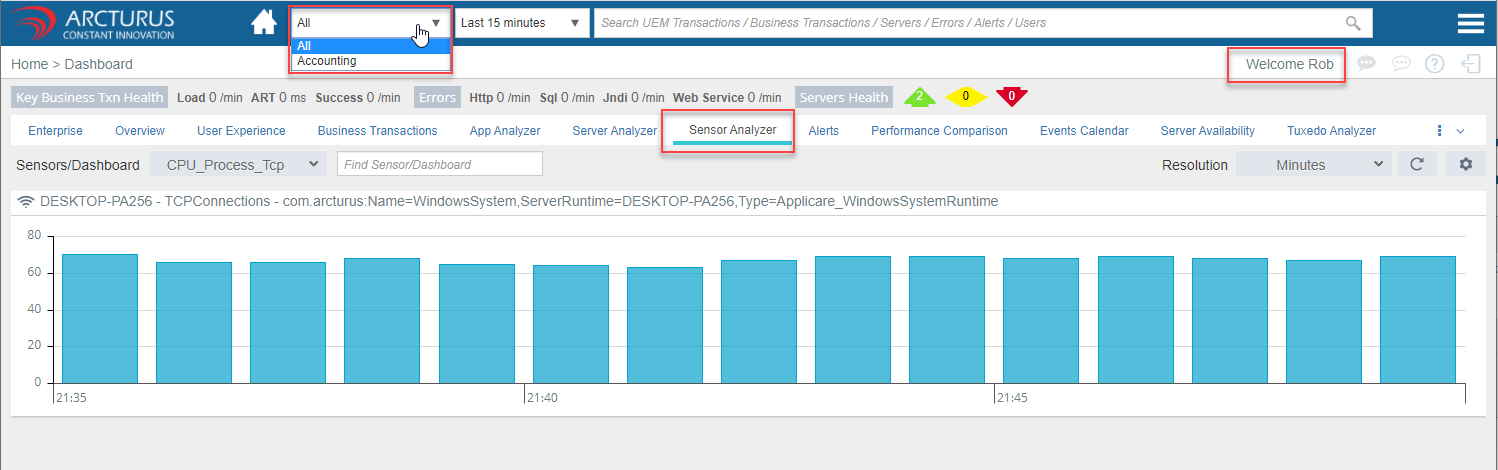
Only Dashboards for Rob will be shown in dropdown.
Combined Sensors Chart
Only Sensors accessible by Rob will be shown.
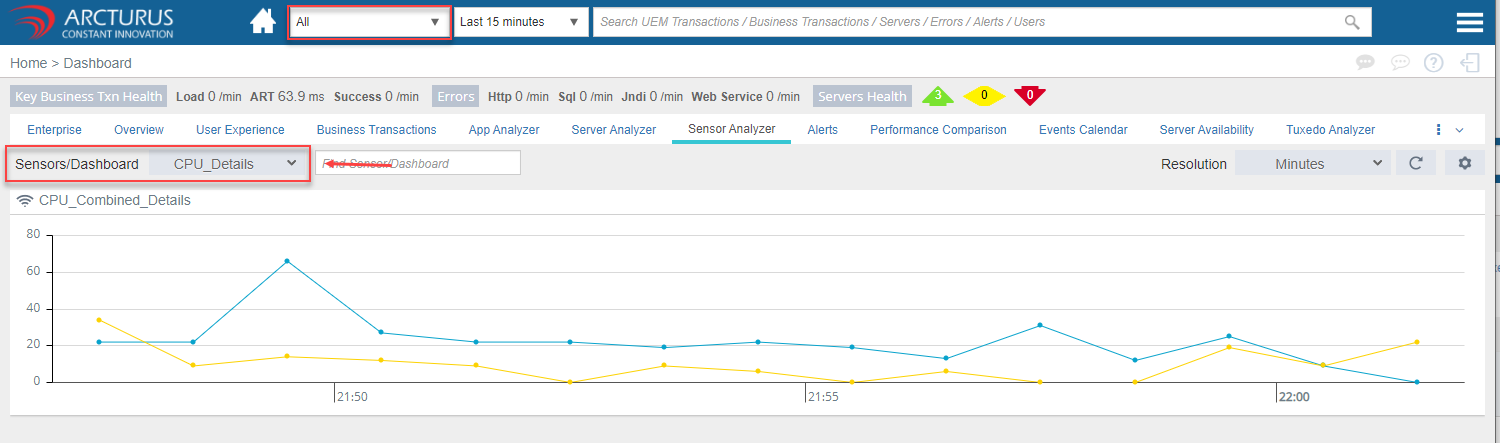
Admin User
Logged in as admin user and viewing the sensors dashboard. All dashboards will be shown in dropdown

Combined Sensor Charts
Combined sensor chart shows all the sensors for admin user.
Please sign in to leave a comment.
Comments
0 comments