
Recording script with Badboy and creating synthetic monitor in Applicare.

1. Download the badboy installer from the below link
https://arc-temp.s3.amazonaws.com/badboyinstaller-2.2.exe
2. Start the Installation.
Choose installation directory after accepting the license agreement


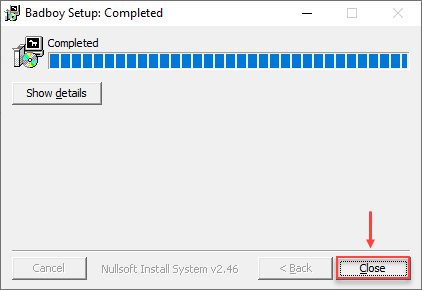
3. After completing the installation click the "Close" button.
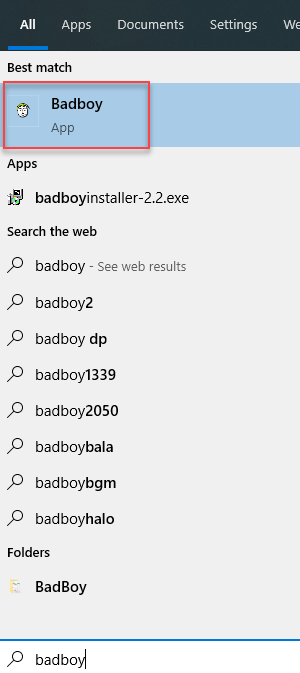
4. Enter "badboy" in the start menu and select the app to open it.
5. Use the "Red" circle to "start/stop" the recording. By default it will start the recording at the time of open.
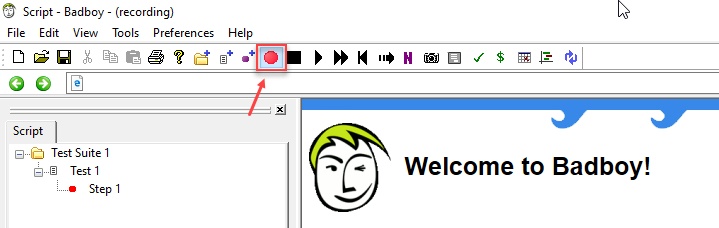
6. If the recording is on it will display the "(recording)" message in the title bar. If the recording is off then the "(recording)" message will not be displayed in the title bar.
Recording Started:

Recording Stopped:

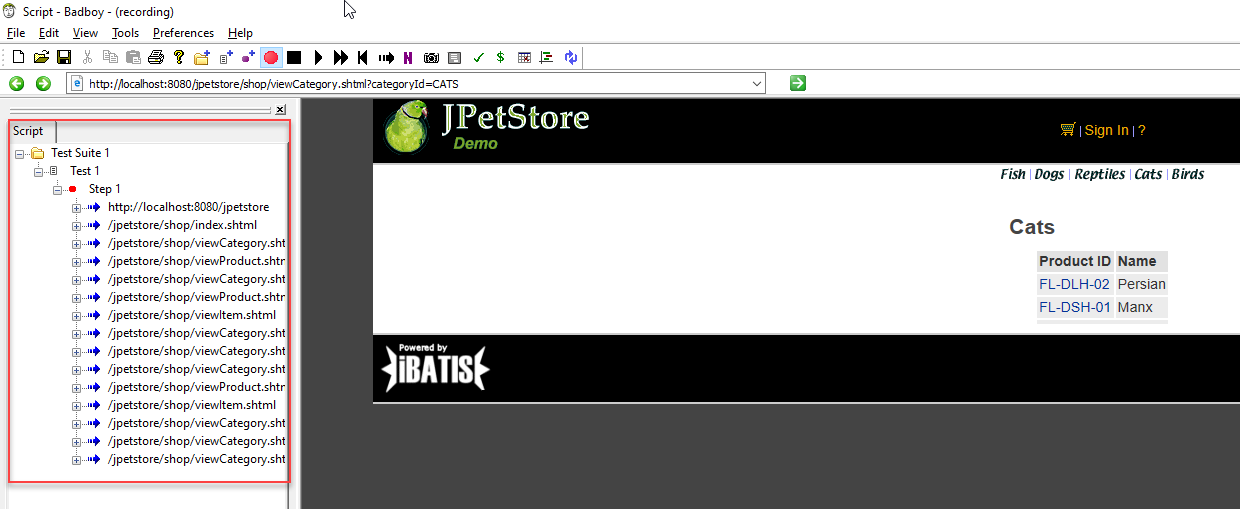
7. To start recording the requests enter the application url in the address bar and press enter. The application will be opened.

8. Hit the requests in the application. All the requests will be captured and displayed in the left hand side.
9. Stop the recording by clicking the "Red" circle button.
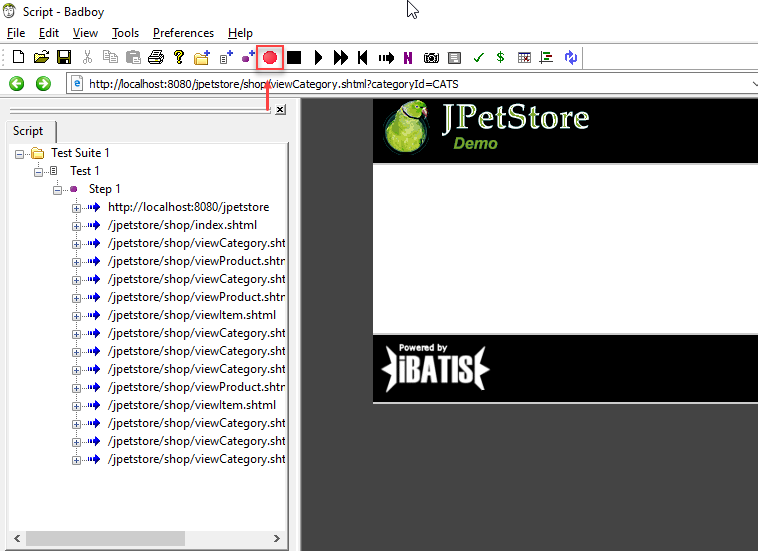
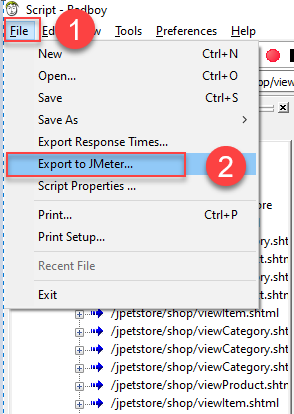
10. After stopping the recording export it to a JMeter script. For that select File-> Export to JMeter option from menu.
11. Enter the file name and save it.

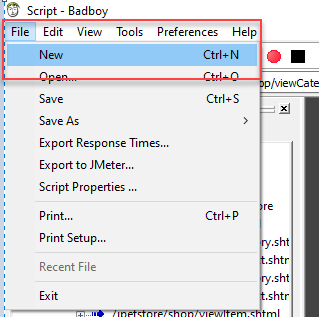
12. For new recording select File-> New from menu.
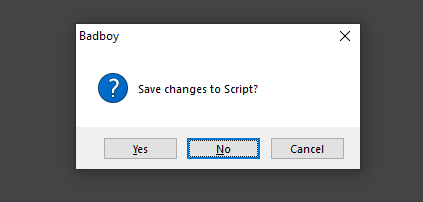
13. If the below popup is displayed then select the option based on your choice.
"Save" - To save the script.
"No" - Not to save the script.
Monitoring JMeter Script in Applicare
1. Login into Applicare console.
2. Go to User Experience -> Synthetic User Experience Analyzer and click the settings icon.
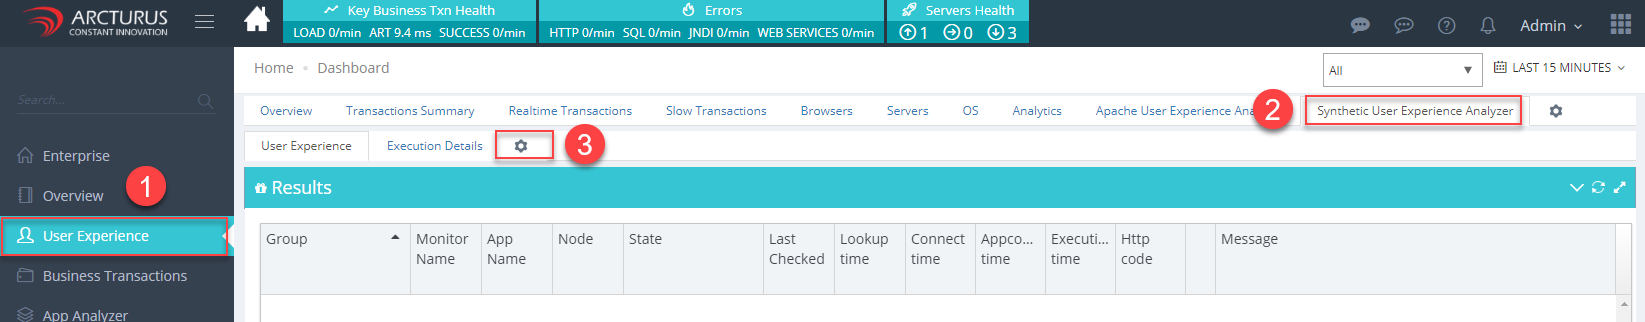
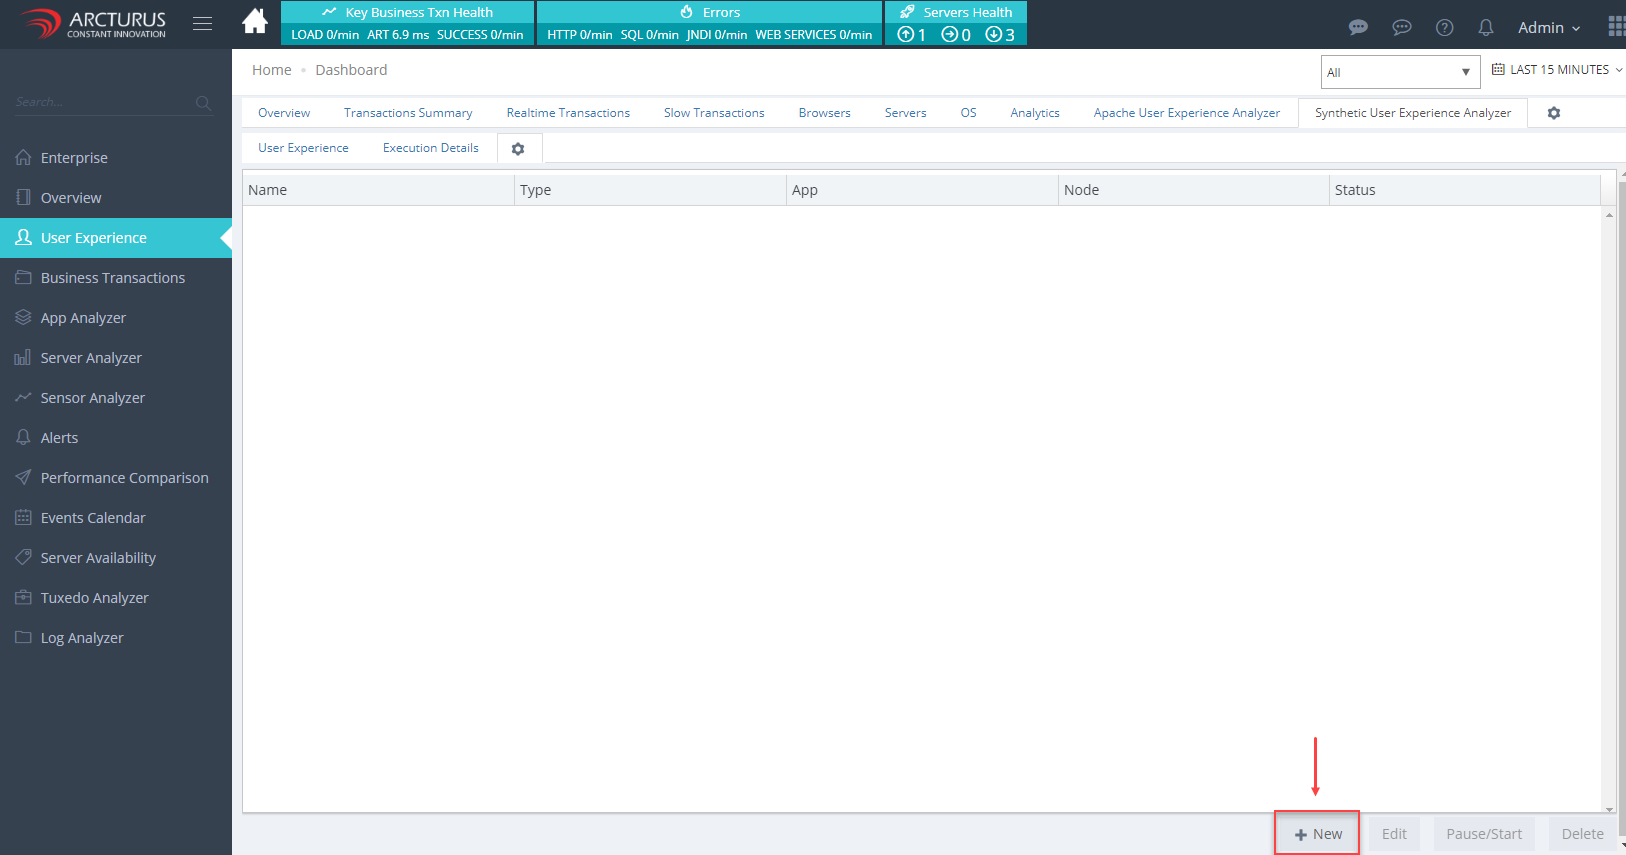
3. Click the"New" button from below.
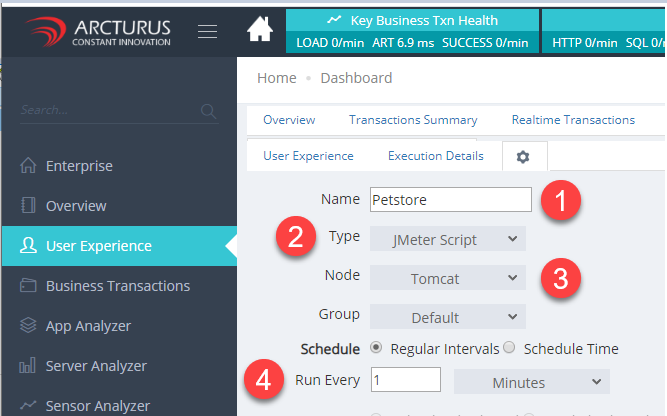
4. Provide the below details
- Enter the "name" in the name filed.
- Select "JMeter Script" option in the Type drop-down.
- Select the "server" in the Node drop-down.
- Enter the time range.
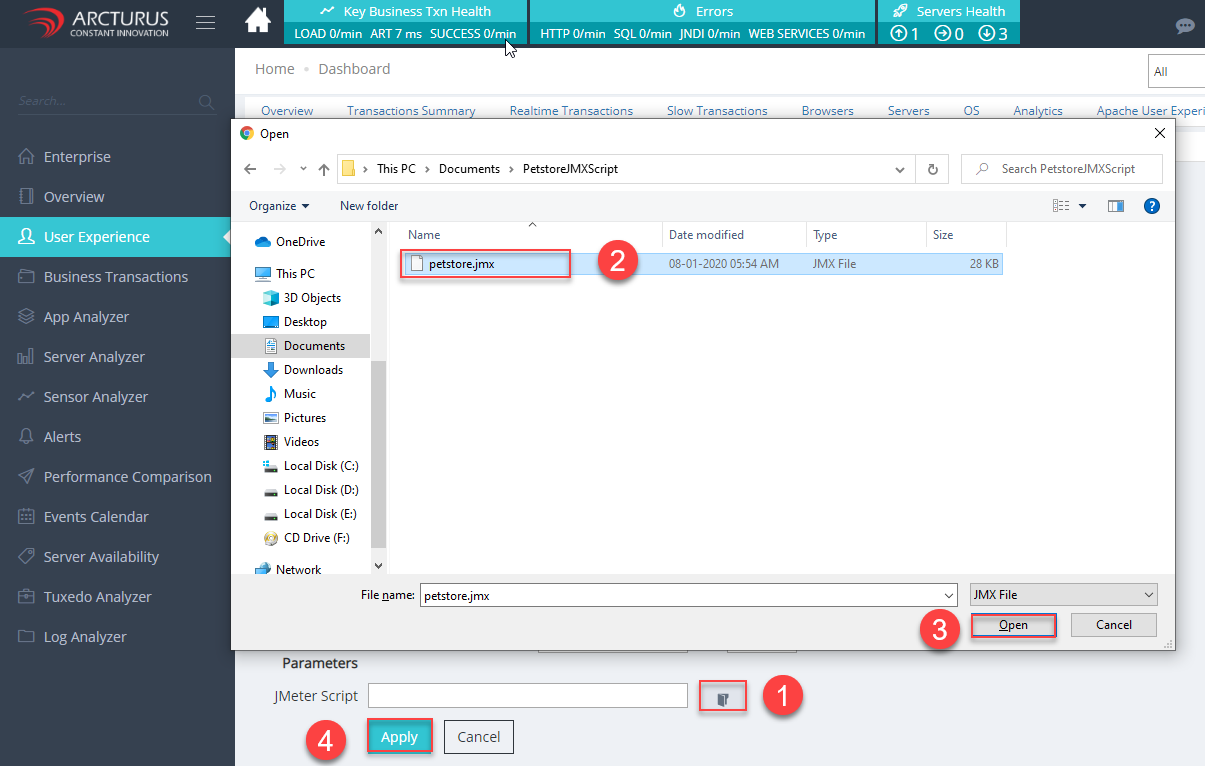
5. Browse the JMeter script file with a (.jmx) extension in the JMeter script field and click the "Apply" button to save the settings.
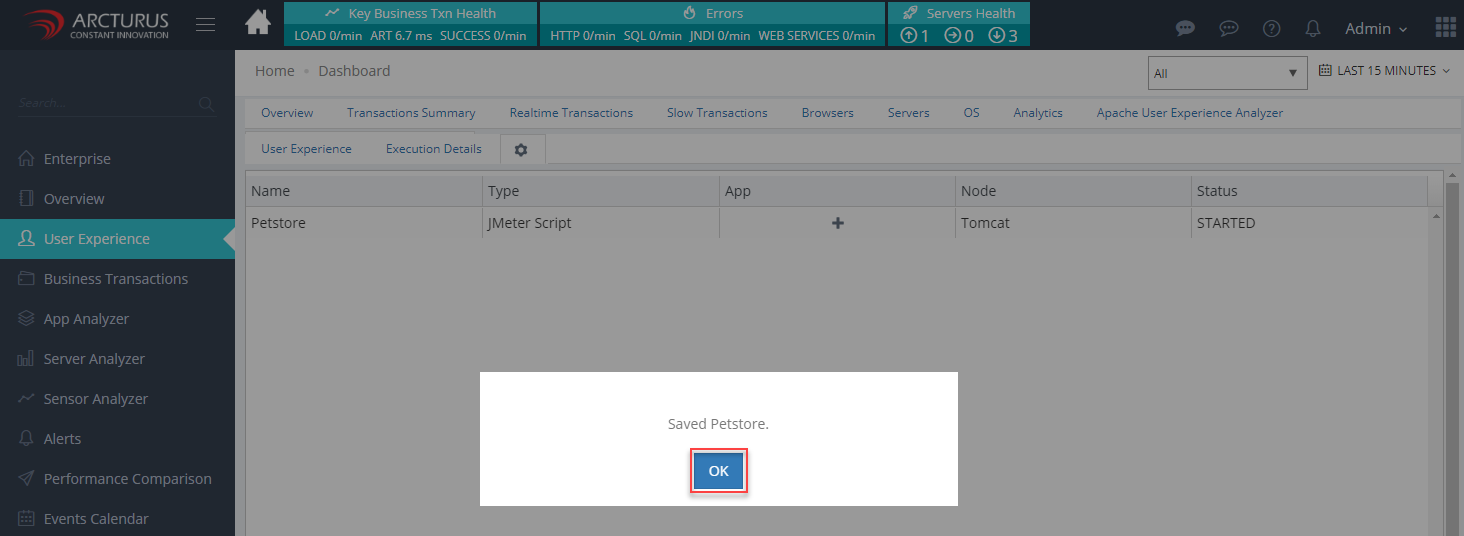
6. Saved details will displayed in the grid. Click "Ok" in the popup.
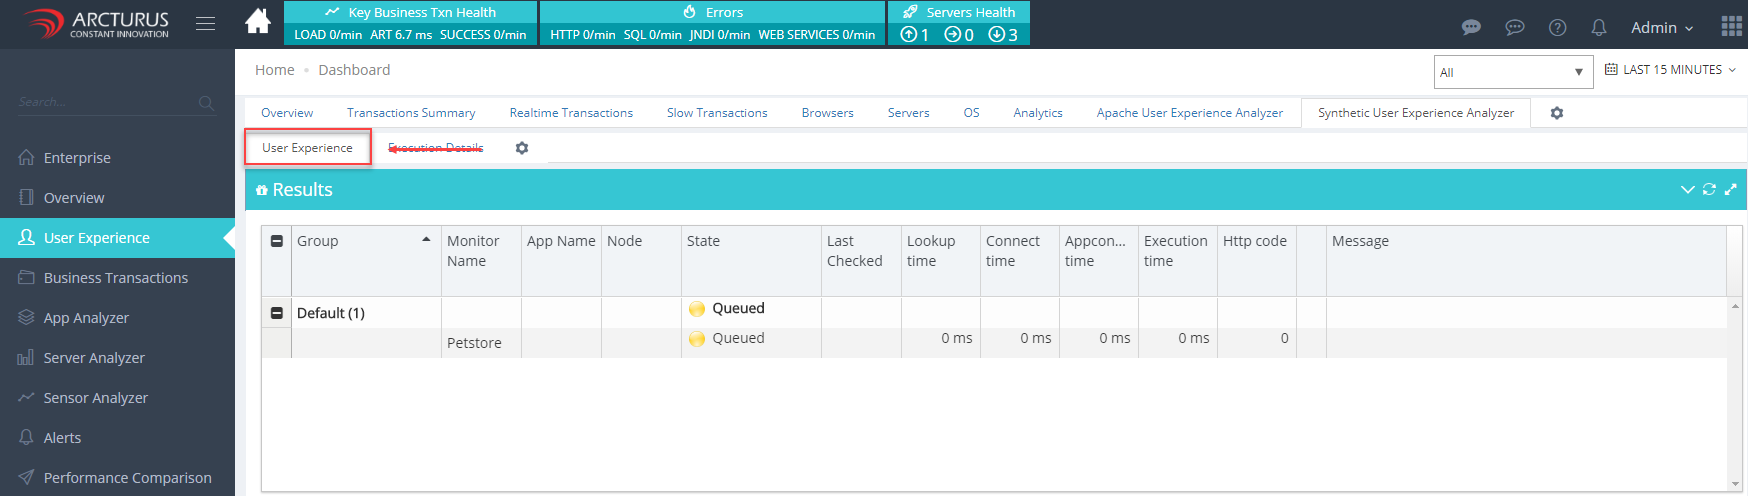
7. Go to "User Experience" menu. The added script will be in queued state. It will start the execution in a minute.
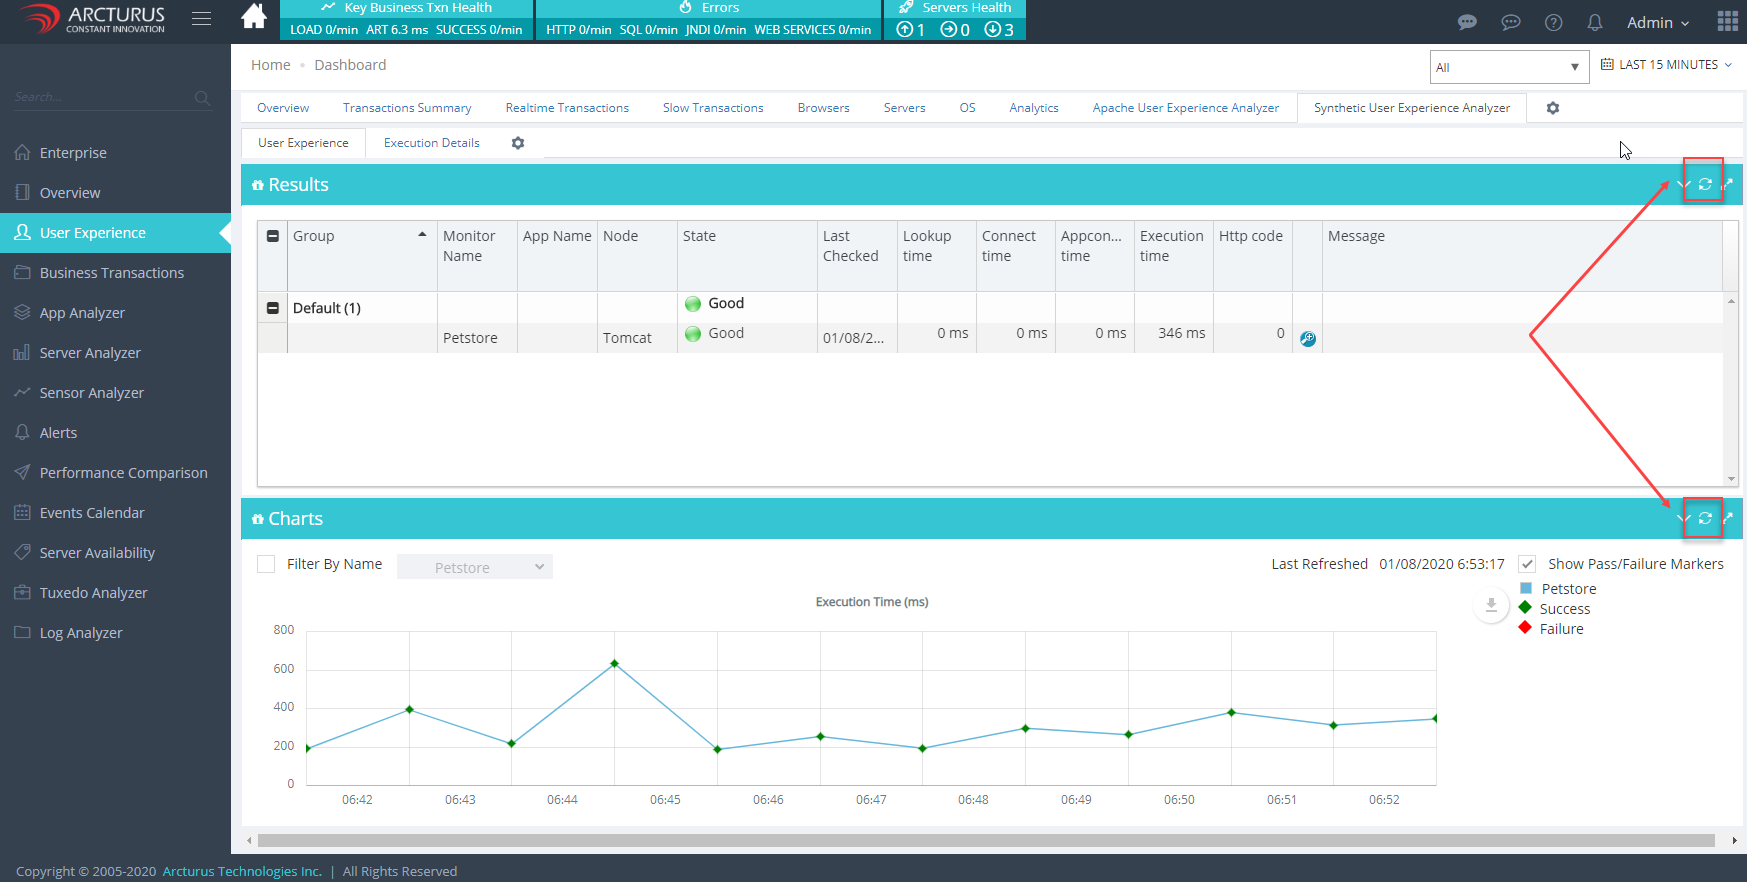
8. Click the "Refresh" button on the grid and graph to view the execution results.
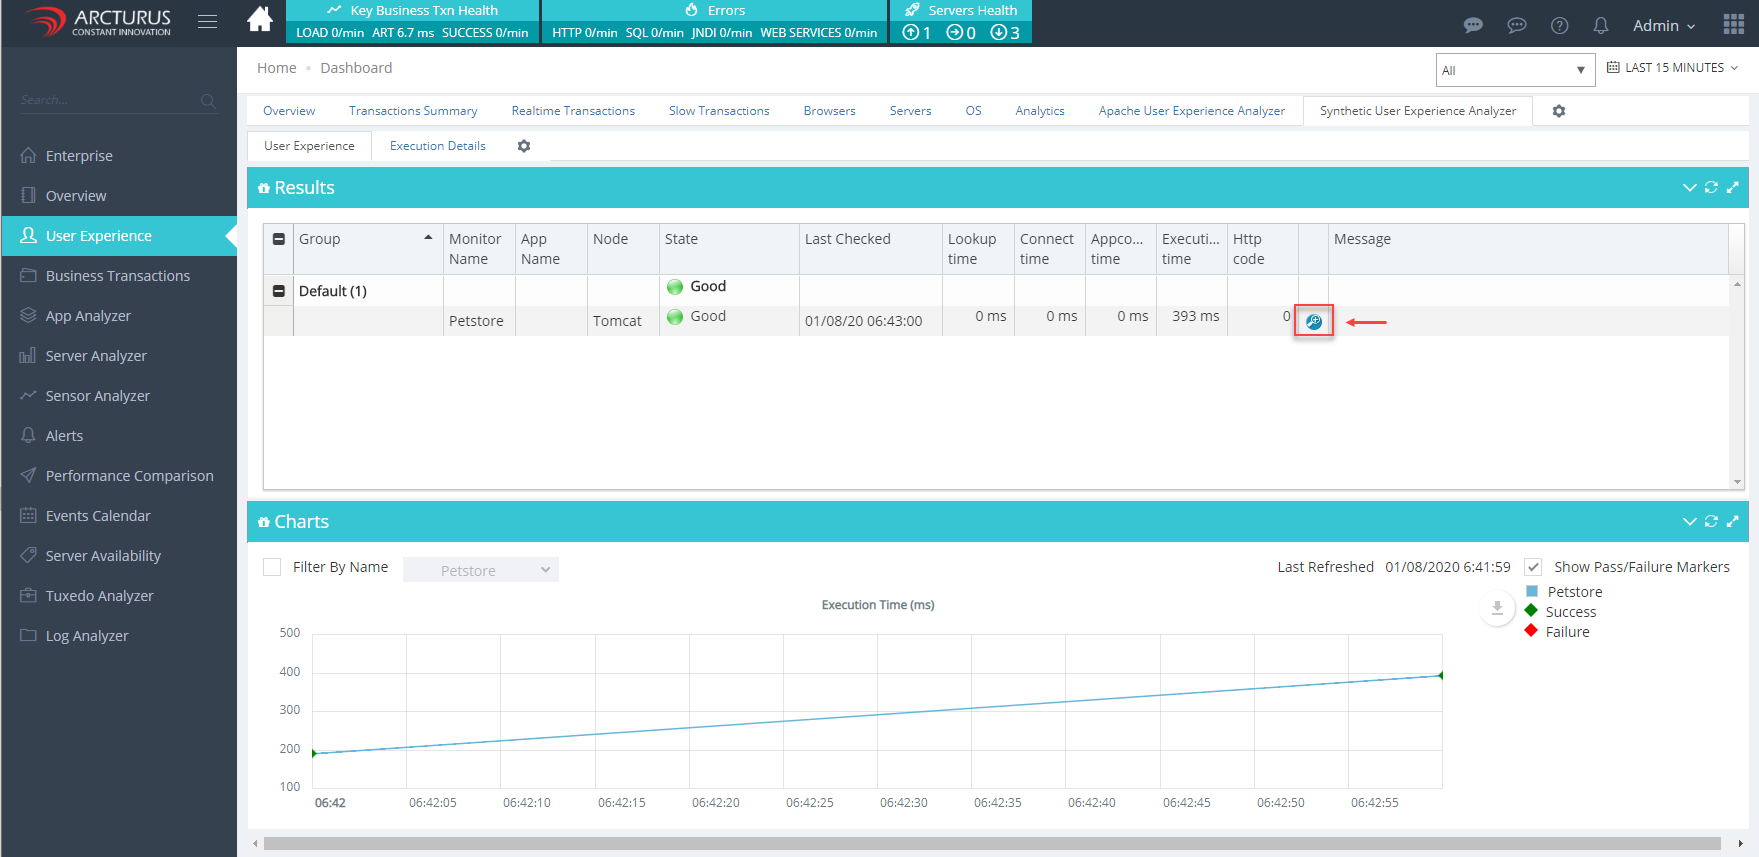
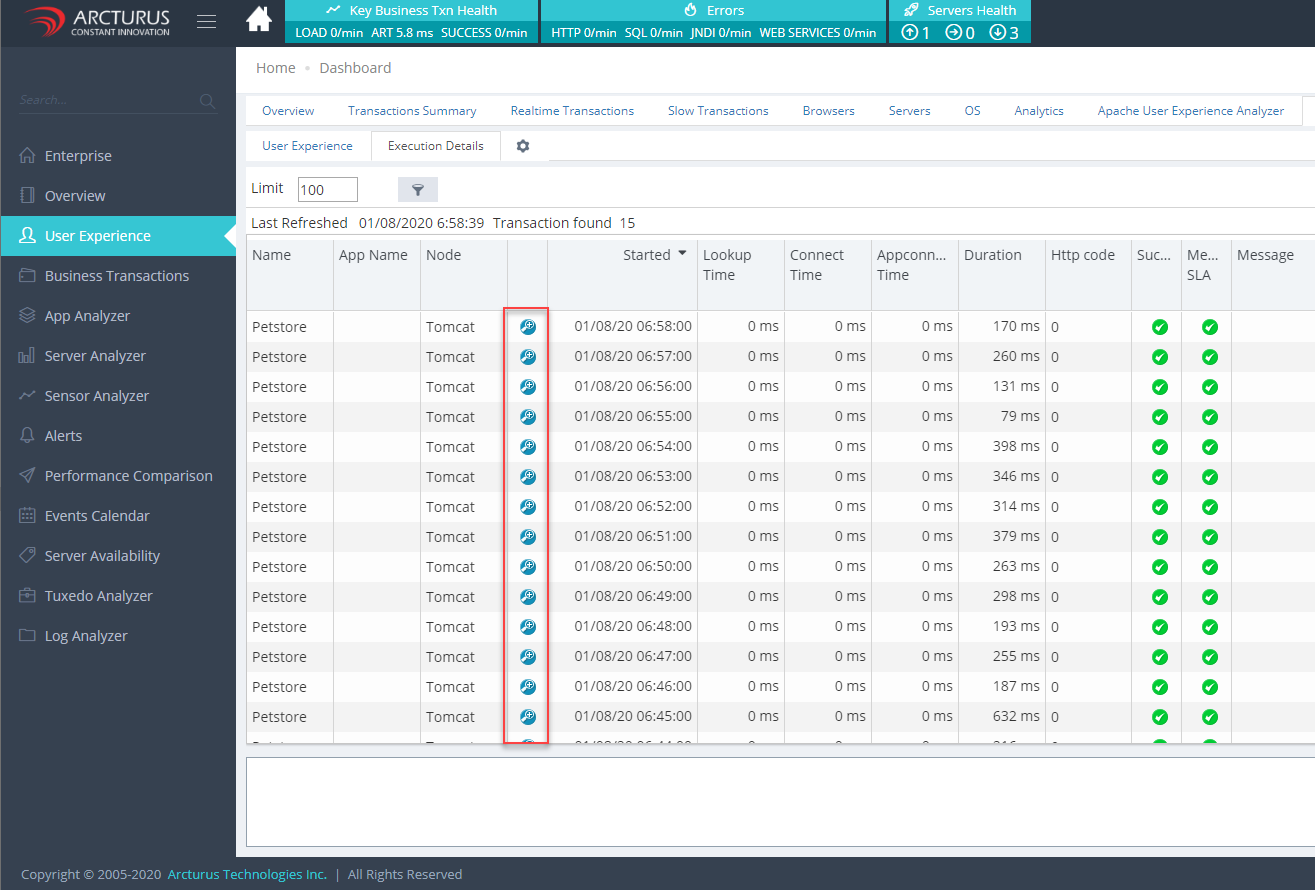
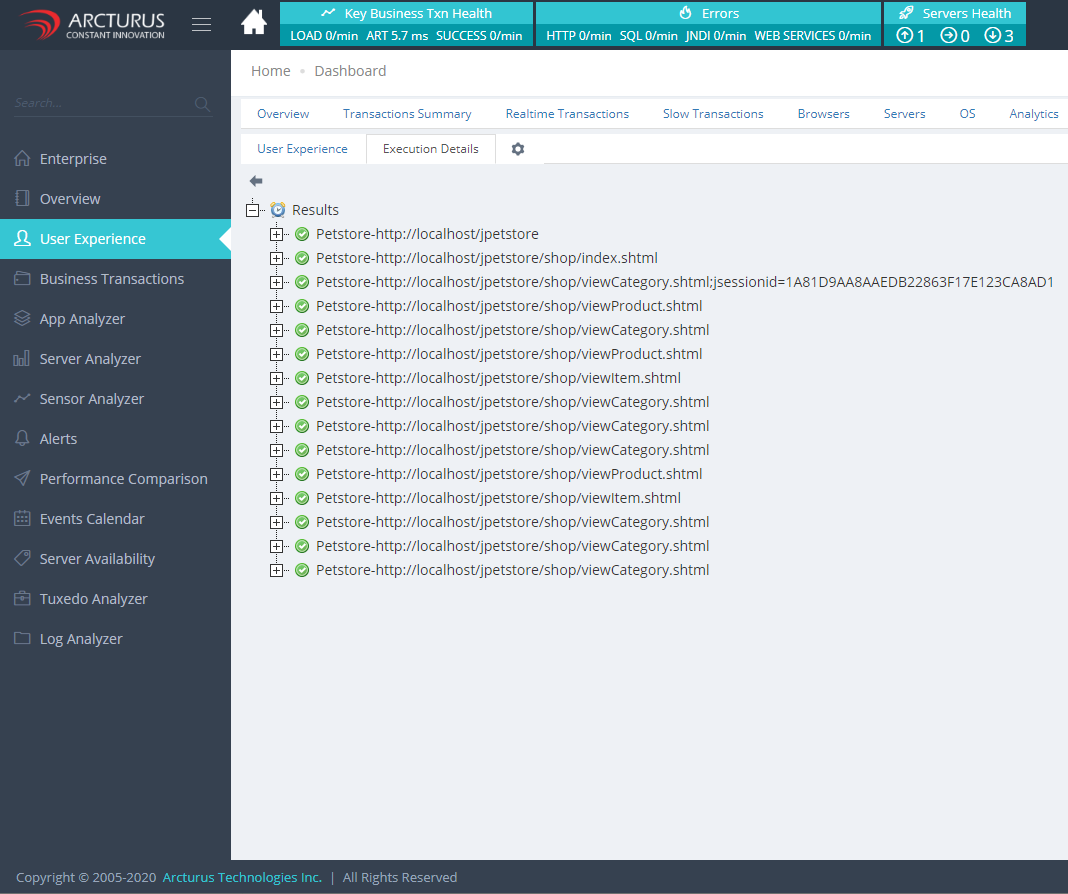
9. To view the last execution request details click the "zoom" icon in the grid.
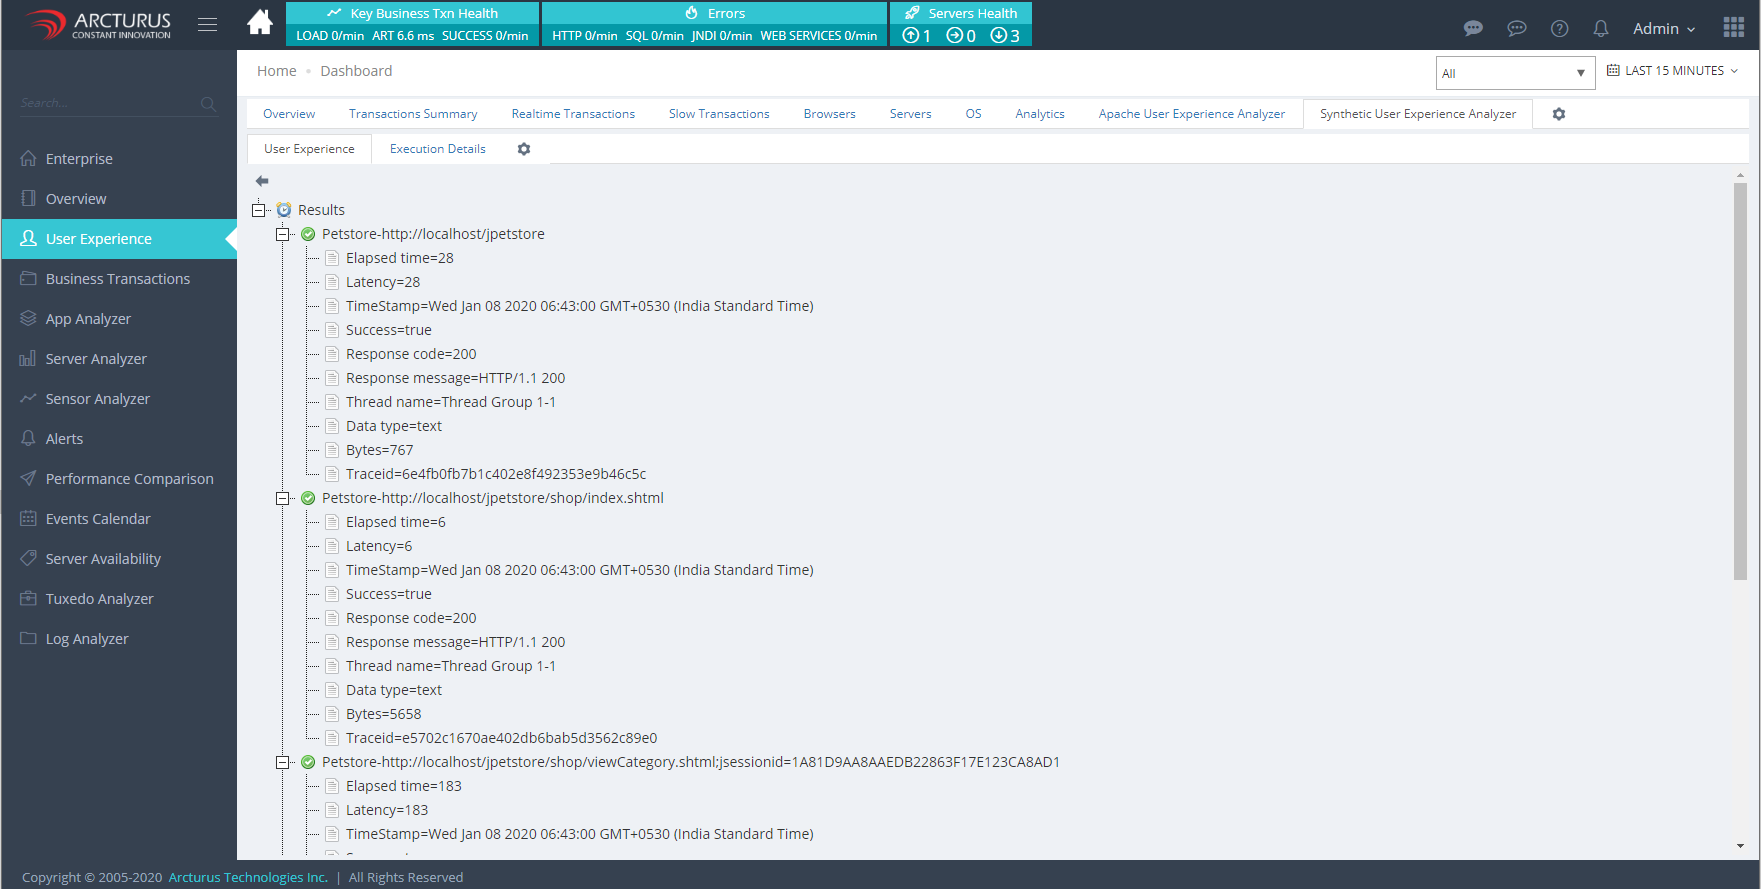
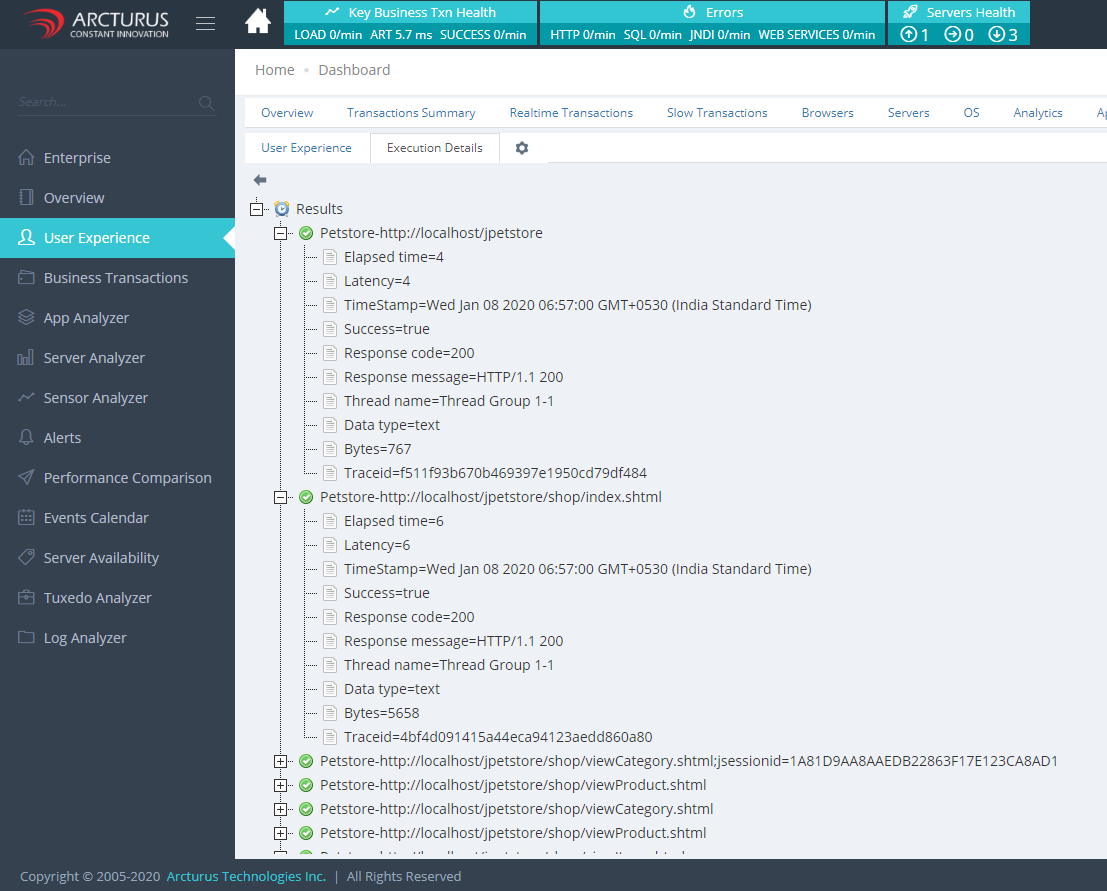
10. The request details will be displayed.
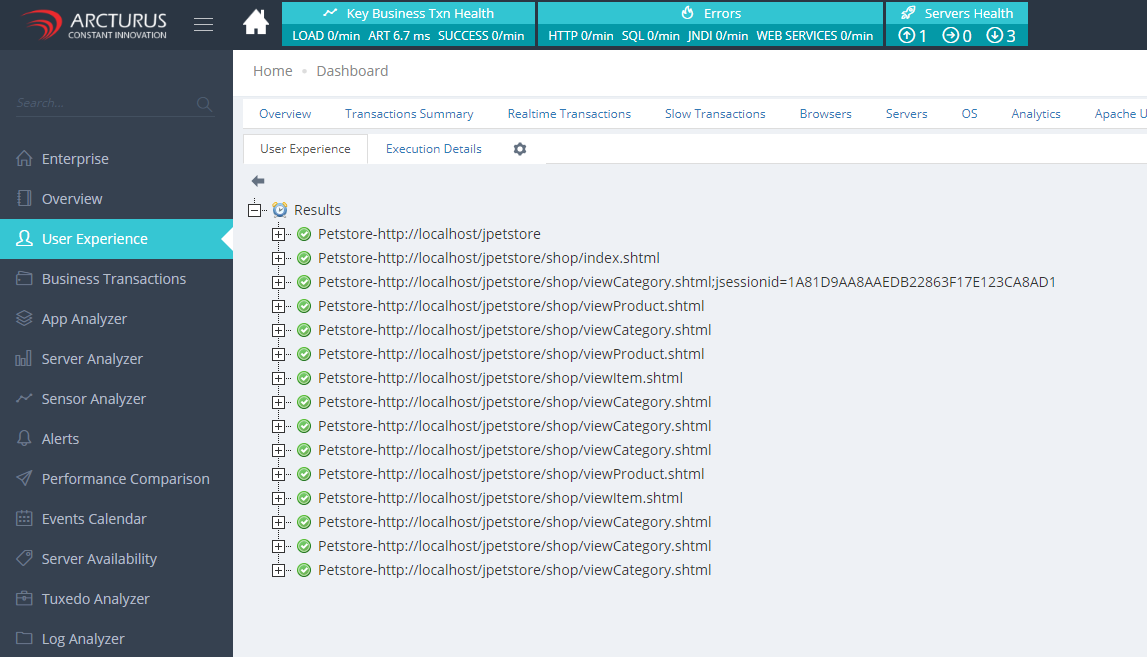
11. Expand the tree to view the individual request results.
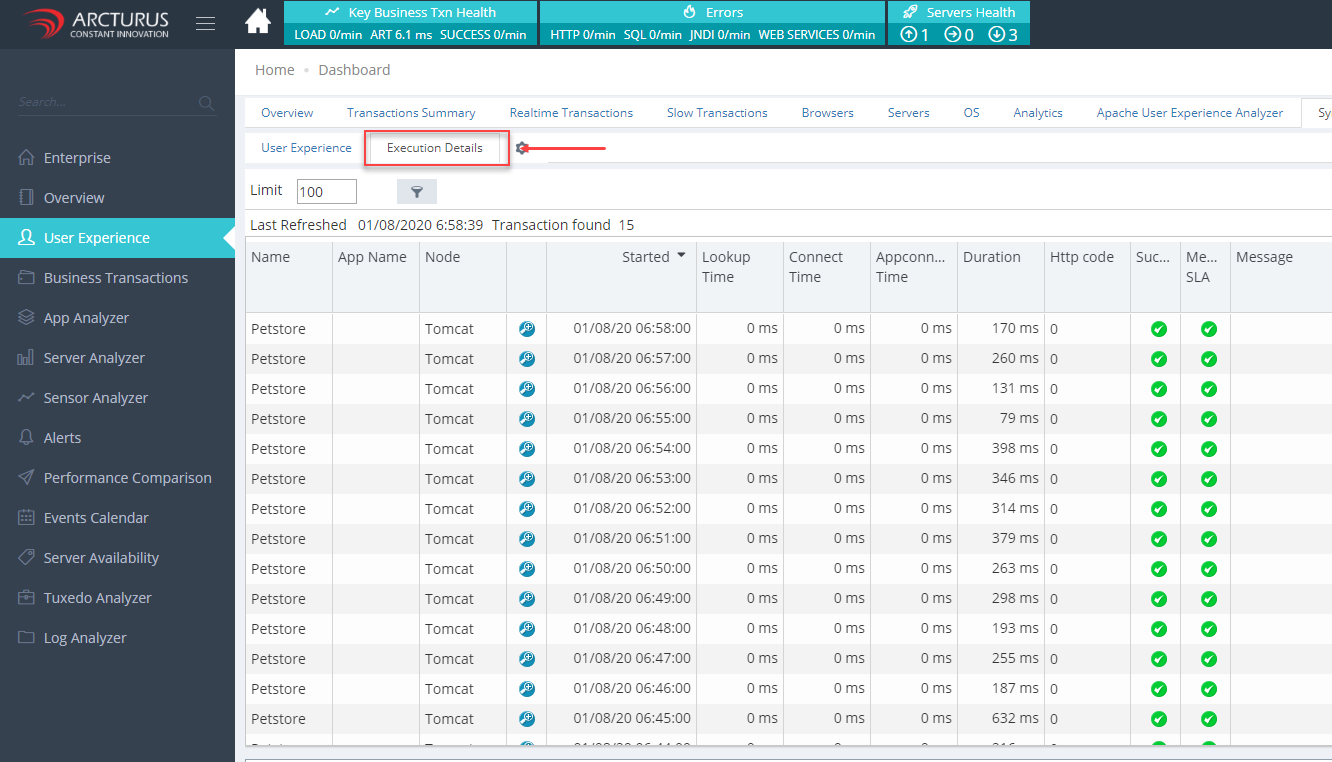
12. All the execution summary list will be displayed in the "Execution Details" screen.
13. Click the "zoom icon" in the grid to view the request results.details.
Please sign in to leave a comment.
Comments
0 comments