

LAMA is an API based performance data gathering and early warning system that is designed to help brokerage firms identify and address potential problems before they cause an outage. It collects data from the broker’s trading systems and uses machine learning to identify patterns that could indicate a problem. If LAMA detects a potential problem, it will generate an alert so that the brokerage firm and exchange can take preventive corrective action. It is a cost-effective way to prevent outages and reduce the risk of financial losses.
NSE India has adopted LAMA and LAMA reporting is a requirement for brokerage firms.
The data sent from Applicare to LAMA represents a consolidated summary of all servers within the application, rather than details for individual servers.
You can access individual server data directly through the Applicare console. Applicare computes the average of this data and posts the aggregated result to LAMA.
It is important to note that data posting to LAMA occurs only while the controller is actively running.
Median formulae for all the metrics: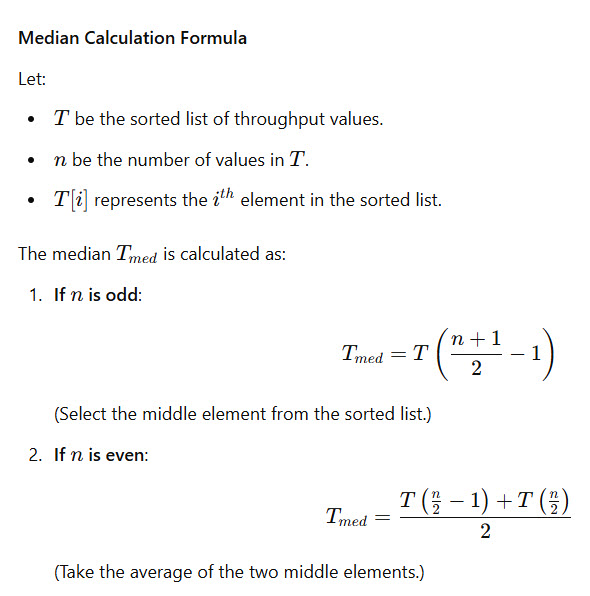
Hardware Metrics
1. CPU (%) - Machine CPU usage. Available in Enterprise -> Summary.
CPU Average = (Sum of CPU usage across all configured applications) / (Total number of configured applications).
Example:
Configured Applications : Nopcom, Petstore
Nopcom CPU values in last 5 minutes -> 10,24,52,34,12
Petstore CPU values in last 5 minutes -> 1,5,20,7,15
CPU Average = (SUM of configured applications CPU) / (Total no. of configured applications CPU)
CPU Average = (10 + 24 + 52 + 34 + 12 + 1 + 5 + 20 + 7 + 15)/ (10)
CPU Average = 18
2. Memory (%) - Machine memory usage. Available in Enterprise -> Summary.
Memory Average = (Sum of memory usage across all configured applications) / (Total number of configured applications)
Example:
Configured Applications : Nopcom, Petstore
Nopcom Memory values in last 5 minutes -> 45,32,52,60,47
Petstore Memory values in last 5 minutes -> 51,53,35,20,55
Memory Average = (SUM of configured applications Memory) / (Total no. of configured applications Memory)
Memory Average = (45 + 32 + 52 + 60 + 47 + 51 + 53 + 35 + 20 + 55)/ (10)
Memory Average = 45
3. Disk (%) - Machine disk usage. Available in Server Analayzer -> OS.
4. Uptime (in minutes) - Availability of the server in the machine for 5 minutes interval. Available in the Enterprise -> Summary.
Exchange DOC
Application Metrics
1. Request per second - Indicates the server's throughput. This metric can be found in Server Analyzer -> App Server.
2. Response Time (milliseconds) - Average Response Time - Reflects the server's average response time. You can find this metric in Server Analyzer -> App Server.
3. Trading Failure API count - Failure count of the trading API's. Available in Key Business Transactions Load Distribution.
4. Client Authentication Failure Auth - Failure count of the client authentication API's. Available in Key Business Transactions Load Distribution.
5. History request per second - Historical throughput of the server.
Available in Server Analyzer -> App Server.
6. Historical Response Time (milliseconds) - Represents the average response time of the server.
Available in Server Analyzer -> App Server.
| Day | Historical Throughput | Historical Latency | LAMA Data (21 days data) | |||||||
| Min | Max | Med | Avg | Min | Max | Med | Avg | |||
| 1 | 100 | 500 | 125 | 326 | 1000 | 5000 | 1245 | 3567 | Average of Day1 | |
| 2 | 100 | 500 | 125 | 326 | 1000 | 5000 | 1245 | 3567 | Average of Day 1 to 2 | |
| 3 | 100 | 500 | 125 | 326 | 1000 | 5000 | 1245 | 3567 | Average of Day 1 to 3 | |
| 4 | 100 | 500 | 125 | 326 | 1000 | 5000 | 1245 | 3567 | Average of Day 1 to 4 | |
| 5 | 100 | 500 | 125 | 326 | 1000 | 5000 | 1245 | 3567 | Average of Day 1 to 5 | |
| 6 | 100 | 500 | 125 | 326 | 1000 | 5000 | 1245 | 3567 | Average of Day 1 to 6 | |
| 7 | 100 | 500 | 125 | 326 | 1000 | 5000 | 1245 | 3567 | Average of Day 1 to 7 | |
| 8 | 100 | 500 | 125 | 326 | 1000 | 5000 | 1245 | 3567 | Average of Day 1 to 8 | |
| 9 | 100 | 500 | 125 | 326 | 1000 | 5000 | 1245 | 3567 | Average of Day 1 to 9 | |
| 10 | 100 | 500 | 125 | 326 | 1000 | 5000 | 1245 | 3567 | Average of Day 1 to 10 | |
| 11 | 100 | 500 | 125 | 326 | 1000 | 5000 | 1245 | 3567 | Average of Day 1 to 11 | |
| 12 | 100 | 500 | 125 | 326 | 1000 | 5000 | 1245 | 3567 | Average of Day 1 to 12 | |
| 13 | 100 | 500 | 125 | 326 | 1000 | 5000 | 1245 | 3567 | Average of Day 1 to 13 | |
| 14 | 100 | 500 | 125 | 326 | 1000 | 5000 | 1245 | 3567 | Average of Day 1 to 14 | |
| 15 | 100 | 500 | 125 | 326 | 1000 | 5000 | 1245 | 3567 | Average of Day 1 to 15 | |
| 16 | 100 | 500 | 125 | 326 | 1000 | 5000 | 1245 | 3567 | Average of Day 1 to 16 | |
| 17 | 100 | 500 | 125 | 326 | 1000 | 5000 | 1245 | 3567 | Average of Day 1 to 17 | |
| 18 | 100 | 500 | 125 | 326 | 1000 | 5000 | 1245 | 3567 | Average of Day 1 to 18 | |
| 19 | 100 | 500 | 125 | 326 | 1000 | 5000 | 1245 | 3567 | Average of Day 1 to 19 | |
| 20 | 100 | 500 | 125 | 326 | 1000 | 5000 | 1245 | 3567 | Average of Day 1 to 20 | |
| 21 | 100 | 500 | 125 | 326 | 1000 | 5000 | 1245 | 3567 | Average of Day 1 to 21 | |
| 22 | 100 | 500 | 125 | 326 | 1000 | 5000 | 1245 | 3567 | Average of Day 2 to 22 | |
| 23 | 100 | 500 | 125 | 326 | 1000 | 5000 | 1245 | 3567 | Average of Day 3 to 23 | |
| 24 | 100 | 500 | 125 | 326 | 1000 | 5000 | 1245 | 3567 | Average of Day 4 to 24 | |
| 25 | 100 | 500 | 125 | 326 | 1000 | 5000 | 1245 | 3567 | Average of Day 5 to 25 | |
| 26 | 100 | 500 | 125 | 326 | 1000 | 5000 | 1245 | 3567 | Average of Day 6 to 26 | |
| 27 | 100 | 500 | 125 | 326 | 1000 | 5000 | 1245 | 3567 | Average of Day 7 to 27 | |
| 28 | 100 | 500 | 125 | 326 | 1000 | 5000 | 1245 | 3567 | Average of Day 8 to 28 | |
| 29 | 100 | 500 | 125 | 326 | 1000 | 5000 | 1245 | 3567 | Average of Day 9 to 29 | |
| 30 | 100 | 500 | 125 | 326 | 1000 | 5000 | 1245 | 3567 | Average of Day 10 to 30 | |
| 31 | 100 | 500 | 125 | 326 | 1000 | 5000 | 1245 | 3567 | Average of Day 11 to 31 | |
| 32 | 100 | 500 | 125 | 326 | 1000 | 5000 | 1245 | 3567 | Average of Day 12 to 32 | |
| 33 | 100 | 500 | 125 | 326 | 1000 | 5000 | 1245 | 3567 | Average of Day 13 to 33 | |
7. Log Monitoring - Error codes configured in the LAMA of the configured Applications. Available in Errors screen.
Exchange DOC
Network Metrics
1. Bandwidth (%) - It is the average of both the input and output bandwidth utilization of the interface in the router.
Configured Mbps = 1000 // 1Gbps  Default value

Input rate in bits / sec - (IfInOctects * 0.8) / 60;
Output rate in bits / sec - (IfOutOctects * 0.8) / 60;

Input Utilization:
Input Utilization (%) = ((Input Rates in bits/sec) / (Configured Mbps * 1000000)) * 100;

Output Utilization:
Output Utilization (%) = ((Output Rates in bits/sec) / (Configured Mbps * 1000000)) * 100;

Bandwidth Utilization = (Input Utilization (%) + Output Utilization (%)) / 2;

Example:
Configured Mbps - 300Mbps
Input Utilization (%) = (47575000 / (300 * 1000000)) * 100;
Input Utilization (%) = 15.86

Output Utilization (%) = (157305000 / (300 * 1000000)) * 100;
Output Utilization (%) = 52.44

Bandwidth Utilization = (15.86 + 52.44) / 2
Bandwidth Utilization (%) = 34.152. Packet error count - Sum of current Input and output error count of the interface in the router via SNMP.
ifinErrors
ifOutErrors
Packet error count = (ifinErrors+ ifOutErrors)Exchange DOC
Important:
The Exchanges have decided to deprecate the below-listed parameters.
Network Latency
DNS Lookup Count
Database Metrics
ORACLE DB
1. Replication status - Refers to the availability of the replication process, not the availability of the database itself.
select process from v$managed_standby where process='<PROCESS_NAME>' fetch first 1 row onlyExample:
PROCESS_NAME - MRP0
Here MRP0 is the process which is doing the replication. If the process is active, the replication status will be "Up." If the process is not running, the status will be "Down."
2. Replication Queue size - Pending log sync count in the replication.
SELECT MAX(A.SEQUENCE#) FROM V$ARCHIVED_LOG A,v$archive_dest_status b where (a.dest_id='1' or a.applied ='YES') and a.dest_id=b.dest_id group by b.destination,b.ERROR, a.dest_id, thread# order by a.thread#Here it will give the list of SEQUENCE#. The SEQUENCE# will be sorted in the descending order and the difference of the first two values will be calculated as a queue size.
Example:
Intital Result
86773
86632
86775

Result after sorting
86775
86773
86632

Queue Size = Value1 - Value2
Queue Size = 86775 - 86773
Queue Size = 2
3. Replication Bandwidth (%) - Bandwidth Utilization of the Database.
select AVG(round((blocks*block_size/1024/1024)/((next_time-first_time)*86400),2)) as bytesinMbps from v$archived_log where ((next_time-first_time)*86400<>0) and first_time between to_date('FROM_DATE','YYYY/MM/DD HH24:MI:SS') and to_date('TO_DATE','YYYY/MM/DD HH24:MI:SS') and dest_id=1FROM_DATE and TO_DATE for every 1 minute interval.
Example:
FROM_DATE - 2024/05/02 16:13:00
TO_DATE - 2024/05/02 16:14:00
Important:
The calculation provided reflects a one-minute average. For LAMA, the average is computed over a five-minute period.
SELECT VALUE FROM V$DATAGUARD_STATS WHERE UPPER(NAME)='APPLY LAG'MySQL DB
1. Replication status - Refers to the availability of the replication process, not the availability of the database itself.
For MySQL < 8.0.22
SHOW SLAVE STATUS;
For MySQL ≥ 8.0.22
SHOW REPLICA STATUS;
Logic
MySQL < 8.0.22
-
DB Status is UP when:
- Slave_IO_Running =
Yes - Slave_SQL_Running =
Yes
- Slave_IO_Running =
-
DB Status is DOWN when:
- Either of the above is not
Yes
- Either of the above is not
MySQL ≥ 8.0.22
-
DB Status is UP when:
- Replica_IO_Running =
Yes - Replica_SQL_Running =
Yes
- Replica_IO_Running =
-
DB Status is DOWN when:
- Either of the above is not
Yes
- Either of the above is not
2. Replication Queue size - Pending log sync count in the replication.
Logic
MySQL < 8.0.22
Queue Size = Read_Master_Log_Pos - Exec_Master_Log_Pos

MySQL ≥ 8.0.22
Queue Size = Read_Source_Log_Pos - Exec_Source_Log_Pos
3. Replication Bandwidth (%) - Bandwidth Utilization of the Database.
SHOW GLOBAL STATUS WHERE Variable_name IN ('Bytes_received', 'Bytes_sent');Logic
Step 1: Delta Calculation
Delta Bytes = Current Value - Previous Value
Step 2: Convert to Bits/sec
Bandwidth (bps) = (Delta Bytes / Time Interval) * 8
Step 3: Utilization % for 1 Gbps
Utilization (%) = (Bandwidth / 1000000000) * 100
4. Replication Latency (microseconds) - Time delay occurred on the data transfer.
Logic
MySQL < 8.0.22
Latency = Seconds_Behind_Master * 1000000

MySQL ≥ 8.0.22
Latency = Seconds_Behind_Source * 1000000
Exchange DOC
LAMA Holiday Configuration
If the Exclude Holidays check box is checked in the LAMA configuration then both the data collection and data post will be skipped for LAMA based on the LAMA Holiday Configuration.
LAMA Holidays
Holiday API
The holiday will be checked in two conditions.
1. Holiday API is added in the LAMA Holidays screen
Every day after 12:00 AM the api will be triggered once and check whether that day is holiday or not. If yes then both the data collection and data post will be skipped on that day. Otherwise the data collection and data post will happen on that day.
Note:
It is not mandatory to update the holidays in the LAMA Holidays screen. Because controller will automatically update the holiday details from that API. The holiday details will be updated only for that current day.
2. Holiday API is not added in the LAMA Holidays screen
The holiday condition will be fully evaluated based on the days configured in the LAMA Holidays screen.
LAMA Logs
By default only error logs and the API check log for LAMA will be printed in the ApplicareAdmin.log file. The log file will be flushed once it reaches 10 MB.
Steps to enable the success log for LAMA.
1. Go to Applicare Advanced Options menu.
2. Enter the value PostDataToApiJob in the Enable Custom Logging field.
3. Click the Submit button to apply and save your changes.
Steps to disable the success log for LAMA.
1. Remove the PostDataToApiJob value from the Enable Custom Logging field.
2. Click the Submit button to save the changes.
Important:
Controller restart is not required.
LAMA Details
Red color row - Data posting does not occur at regular intervals.
Green color row - Data posting begins occurring at regular intervals.
Error Count Column
- Red color - If there was any errors posted to LAMA this column will be displayed in red color with the total error count. Click that column to view the error details posted to LAMA.
- No color with 0 value - No errors have been posted to LAMA.
- No color with NA value - No errors have been posted to LAMA.
Updated Metrics Details from the Exchange.
Comments
0 comments
Article is closed for comments.